German vs Colombian Male Poverty
COMPARE
German
Colombian
Male Poverty
Male Poverty Comparison
Germans
Colombians
10.1%
MALE POVERTY
98.3/ 100
METRIC RATING
55th/ 347
METRIC RANK
11.0%
MALE POVERTY
63.0/ 100
METRIC RATING
158th/ 347
METRIC RANK
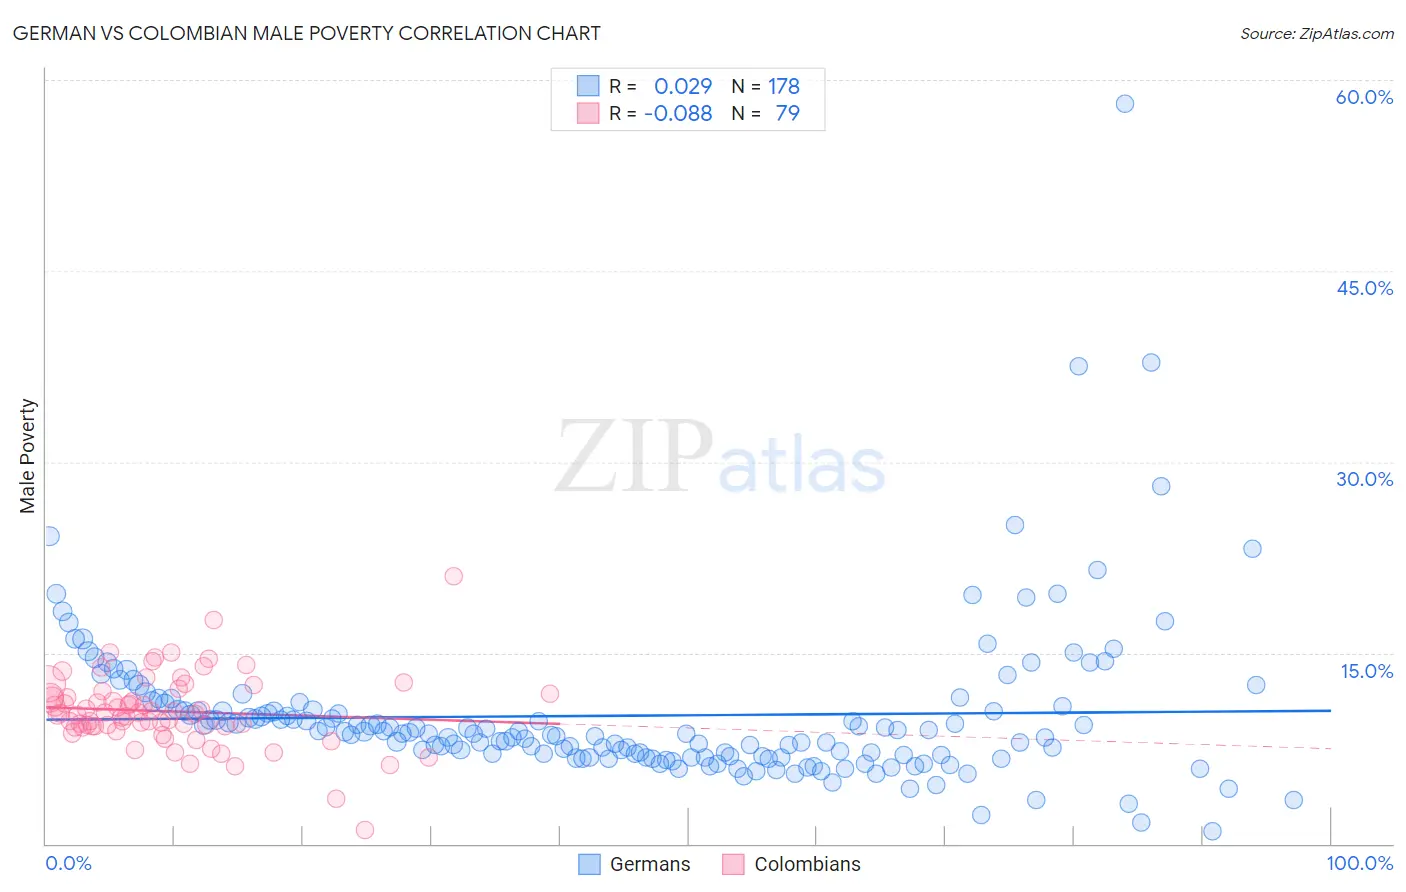
German vs Colombian Male Poverty Correlation Chart
The statistical analysis conducted on geographies consisting of 578,875,550 people shows no correlation between the proportion of Germans and poverty level among males in the United States with a correlation coefficient (R) of 0.029 and weighted average of 10.1%. Similarly, the statistical analysis conducted on geographies consisting of 419,146,336 people shows a slight negative correlation between the proportion of Colombians and poverty level among males in the United States with a correlation coefficient (R) of -0.088 and weighted average of 11.0%, a difference of 9.6%.
Male Poverty Correlation Summary
| Measurement | German | Colombian |
| Minimum | 1.0% | 1.0% |
| Maximum | 58.2% | 21.0% |
| Range | 57.2% | 20.0% |
| Mean | 10.1% | 10.4% |
| Median | 8.7% | 10.2% |
| Interquartile 25% (IQ1) | 6.9% | 9.2% |
| Interquartile 75% (IQ3) | 10.5% | 11.8% |
| Interquartile Range (IQR) | 3.7% | 2.5% |
| Standard Deviation (Sample) | 6.3% | 2.9% |
| Standard Deviation (Population) | 6.3% | 2.9% |
Similar Demographics by Male Poverty
Demographics Similar to Germans by Male Poverty
In terms of male poverty, the demographic groups most similar to Germans are Immigrants from Bulgaria (10.1%, a difference of 0.21%), Immigrants from Austria (10.0%, a difference of 0.29%), Estonian (10.1%, a difference of 0.35%), Scandinavian (10.1%, a difference of 0.42%), and Immigrants from Europe (10.1%, a difference of 0.56%).
| Demographics | Rating | Rank | Male Poverty |
| Immigrants | Japan | 98.8 /100 | #48 | Exceptional 10.0% |
| Slovenes | 98.8 /100 | #49 | Exceptional 10.0% |
| Immigrants | Philippines | 98.7 /100 | #50 | Exceptional 10.0% |
| Immigrants | Croatia | 98.7 /100 | #51 | Exceptional 10.0% |
| Asians | 98.7 /100 | #52 | Exceptional 10.0% |
| Immigrants | Czechoslovakia | 98.6 /100 | #53 | Exceptional 10.0% |
| Immigrants | Austria | 98.5 /100 | #54 | Exceptional 10.0% |
| Germans | 98.3 /100 | #55 | Exceptional 10.1% |
| Immigrants | Bulgaria | 98.2 /100 | #56 | Exceptional 10.1% |
| Estonians | 98.1 /100 | #57 | Exceptional 10.1% |
| Scandinavians | 98.0 /100 | #58 | Exceptional 10.1% |
| Immigrants | Europe | 97.9 /100 | #59 | Exceptional 10.1% |
| Ukrainians | 97.9 /100 | #60 | Exceptional 10.1% |
| Austrians | 97.8 /100 | #61 | Exceptional 10.1% |
| Immigrants | Italy | 97.8 /100 | #62 | Exceptional 10.2% |
Demographics Similar to Colombians by Male Poverty
In terms of male poverty, the demographic groups most similar to Colombians are Taiwanese (11.0%, a difference of 0.030%), Scotch-Irish (11.0%, a difference of 0.080%), Costa Rican (11.0%, a difference of 0.10%), Immigrants from Malaysia (11.0%, a difference of 0.19%), and Immigrants from Kazakhstan (11.0%, a difference of 0.20%).
| Demographics | Rating | Rank | Male Poverty |
| Venezuelans | 67.4 /100 | #151 | Good 11.0% |
| Immigrants | Nepal | 67.3 /100 | #152 | Good 11.0% |
| Immigrants | Bosnia and Herzegovina | 65.2 /100 | #153 | Good 11.0% |
| Immigrants | Kazakhstan | 64.8 /100 | #154 | Good 11.0% |
| Immigrants | Malaysia | 64.7 /100 | #155 | Good 11.0% |
| Costa Ricans | 63.9 /100 | #156 | Good 11.0% |
| Scotch-Irish | 63.7 /100 | #157 | Good 11.0% |
| Colombians | 63.0 /100 | #158 | Good 11.0% |
| Taiwanese | 62.7 /100 | #159 | Good 11.0% |
| Soviet Union | 60.3 /100 | #160 | Good 11.1% |
| Immigrants | Northern Africa | 59.7 /100 | #161 | Average 11.1% |
| Immigrants | Chile | 57.4 /100 | #162 | Average 11.1% |
| Whites/Caucasians | 56.7 /100 | #163 | Average 11.1% |
| Ethiopians | 56.7 /100 | #164 | Average 11.1% |
| Immigrants | Spain | 55.5 /100 | #165 | Average 11.1% |