German Russian vs Dominican Seniors Poverty Over the Age of 75
COMPARE
German Russian
Dominican
Seniors Poverty Over the Age of 75
Seniors Poverty Over the Age of 75 Comparison
German Russians
Dominicans
12.3%
SENIORS POVERTY OVER THE AGE OF 75
41.4/ 100
METRIC RATING
182nd/ 347
METRIC RANK
19.6%
SENIORS POVERTY OVER THE AGE OF 75
0.0/ 100
METRIC RATING
342nd/ 347
METRIC RANK
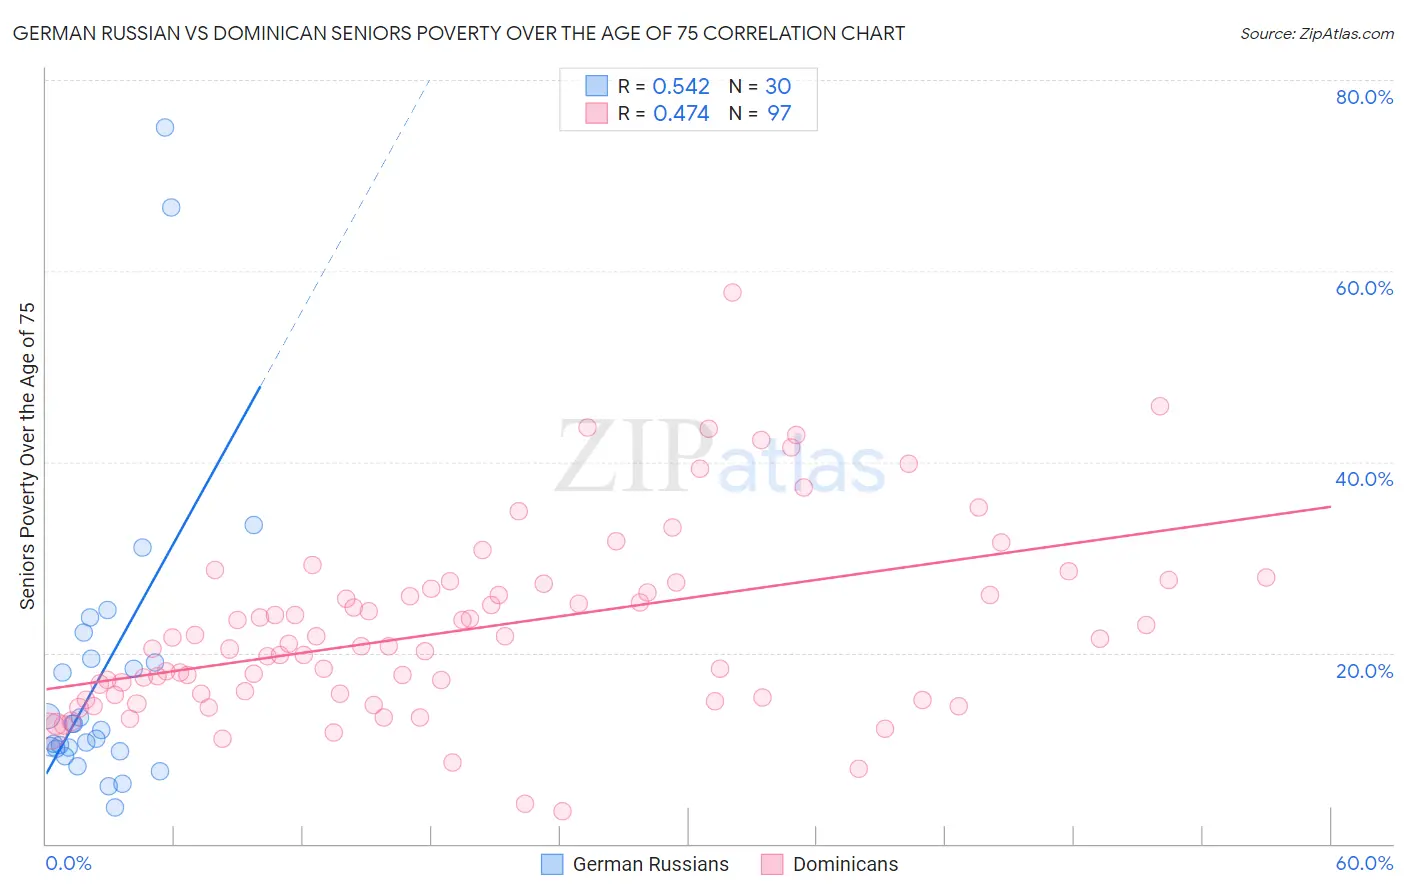
German Russian vs Dominican Seniors Poverty Over the Age of 75 Correlation Chart
The statistical analysis conducted on geographies consisting of 96,005,724 people shows a substantial positive correlation between the proportion of German Russians and poverty level among seniors over the age of 75 in the United States with a correlation coefficient (R) of 0.542 and weighted average of 12.3%. Similarly, the statistical analysis conducted on geographies consisting of 350,851,052 people shows a moderate positive correlation between the proportion of Dominicans and poverty level among seniors over the age of 75 in the United States with a correlation coefficient (R) of 0.474 and weighted average of 19.6%, a difference of 59.8%.
Seniors Poverty Over the Age of 75 Correlation Summary
| Measurement | German Russian | Dominican |
| Minimum | 3.8% | 3.4% |
| Maximum | 75.0% | 57.7% |
| Range | 71.2% | 54.4% |
| Mean | 17.9% | 22.5% |
| Median | 12.2% | 20.8% |
| Interquartile 25% (IQ1) | 9.9% | 15.5% |
| Interquartile 75% (IQ3) | 19.4% | 27.0% |
| Interquartile Range (IQR) | 9.5% | 11.5% |
| Standard Deviation (Sample) | 16.1% | 9.7% |
| Standard Deviation (Population) | 15.8% | 9.6% |
Similar Demographics by Seniors Poverty Over the Age of 75
Demographics Similar to German Russians by Seniors Poverty Over the Age of 75
In terms of seniors poverty over the age of 75, the demographic groups most similar to German Russians are Immigrants from Australia (12.2%, a difference of 0.23%), Immigrants from South Eastern Asia (12.2%, a difference of 0.24%), Laotian (12.3%, a difference of 0.27%), Mongolian (12.2%, a difference of 0.34%), and Nonimmigrants (12.2%, a difference of 0.45%).
| Demographics | Rating | Rank | Seniors Poverty Over the Age of 75 |
| Immigrants | Saudi Arabia | 49.5 /100 | #175 | Average 12.2% |
| Immigrants | Iran | 48.1 /100 | #176 | Average 12.2% |
| Immigrants | Asia | 47.8 /100 | #177 | Average 12.2% |
| Immigrants | Nonimmigrants | 46.8 /100 | #178 | Average 12.2% |
| Mongolians | 45.5 /100 | #179 | Average 12.2% |
| Immigrants | South Eastern Asia | 44.3 /100 | #180 | Average 12.2% |
| Immigrants | Australia | 44.2 /100 | #181 | Average 12.2% |
| German Russians | 41.4 /100 | #182 | Average 12.3% |
| Laotians | 38.2 /100 | #183 | Fair 12.3% |
| Kiowa | 36.0 /100 | #184 | Fair 12.3% |
| Immigrants | Malaysia | 35.8 /100 | #185 | Fair 12.3% |
| Sri Lankans | 32.3 /100 | #186 | Fair 12.4% |
| Yaqui | 25.9 /100 | #187 | Fair 12.5% |
| Immigrants | Northern Africa | 25.2 /100 | #188 | Fair 12.5% |
| Immigrants | Indonesia | 24.4 /100 | #189 | Fair 12.5% |
Demographics Similar to Dominicans by Seniors Poverty Over the Age of 75
In terms of seniors poverty over the age of 75, the demographic groups most similar to Dominicans are Lumbee (19.7%, a difference of 0.66%), Navajo (19.4%, a difference of 1.2%), Immigrants from Cuba (19.9%, a difference of 1.5%), Immigrants from Dominican Republic (20.1%, a difference of 2.2%), and Tohono O'odham (19.1%, a difference of 2.5%).
| Demographics | Rating | Rank | Seniors Poverty Over the Age of 75 |
| Immigrants | Nicaragua | 0.0 /100 | #333 | Tragic 17.6% |
| Immigrants | Grenada | 0.0 /100 | #334 | Tragic 17.8% |
| Cubans | 0.0 /100 | #335 | Tragic 18.0% |
| Immigrants | Caribbean | 0.0 /100 | #336 | Tragic 18.2% |
| Yakama | 0.0 /100 | #337 | Tragic 18.3% |
| Immigrants | Cabo Verde | 0.0 /100 | #338 | Tragic 18.5% |
| Hopi | 0.0 /100 | #339 | Tragic 18.9% |
| Tohono O'odham | 0.0 /100 | #340 | Tragic 19.1% |
| Navajo | 0.0 /100 | #341 | Tragic 19.4% |
| Dominicans | 0.0 /100 | #342 | Tragic 19.6% |
| Lumbee | 0.0 /100 | #343 | Tragic 19.7% |
| Immigrants | Cuba | 0.0 /100 | #344 | Tragic 19.9% |
| Immigrants | Dominican Republic | 0.0 /100 | #345 | Tragic 20.1% |
| Puerto Ricans | 0.0 /100 | #346 | Tragic 23.2% |
| Pima | 0.0 /100 | #347 | Tragic 23.9% |