Finnish vs Swedish Female Poverty Among 25-34 Year Olds

COMPARE

Finnish
Race
Ancestry
AfghanAfricanAlaska NativeAlaskan AthabascanAlbanianAleutAlsatianAmericanApacheArabArapahoArgentineanArmenianAssyrian/Chaldean/SyriacAustralianAustrianBahamianBangladeshiBarbadianBasqueBelgianBelizeanBermudanBhutaneseBlackfeetBolivianBrazilianBritishBritish West IndianBulgarianBurmeseCajunCambodianCanadianCape VerdeanCarpatho RusynCelticCentral AmericanCentral American IndianCherokeeCheyenneChickasawChileanChineseChippewaChoctawColombianColvilleComancheCosta RicanCreeCreekCroatianCrowCubanCypriotCzechCzechoslovakianDanishDelawareDominicanDutchDutch West IndianEastern EuropeanEcuadorianEgyptianEnglishEstonianEthiopianEuropeanFijianFilipinoFinnishFrenchFrench American IndianFrench CanadianGermanGerman RussianGhanaianGreekGuamanian/ChamorroGuatemalanGuyaneseHaitianHmongHonduranHopiHoumaHungarianIcelanderIndian (Asian)IndonesianInupiatIranianIraqiIrishIroquoisIsraeliItalianJamaicanJapaneseJordanianKenyanKiowaKoreanLaotianLatvianLebaneseLiberianLithuanianLumbeeLuxembourgerMacedonianMalaysianMalteseMarshalleseMenomineeMexicanMexican American IndianMongolianMoroccanNative HawaiianNavajoNepaleseNew ZealanderNicaraguanNigerianNorthern EuropeanNorwegianOkinawanOsageOttawaPaiutePakistaniPalestinianPanamanianParaguayanPennsylvania GermanPeruvianPimaPolishPortuguesePotawatomiPuebloPuerto RicanPuget Sound SalishRomanianRussianSalvadoranSamoanScandinavianScotch-IrishScottishSeminoleSenegaleseSerbianShoshoneSierra LeoneanSiouxSlavicSlovakSloveneSomaliSouth AfricanSouth AmericanSouth American IndianSoviet UnionSpaniardSpanishSpanish AmericanSpanish American IndianSri LankanSubsaharan AfricanSudaneseSwissSyrianTaiwaneseThaiTlingit-HaidaTohono O'OdhamTonganTrinidadian and TobagonianTsimshianTurkishU.S. Virgin IslanderUgandanUkrainianUruguayanUteVenezuelanVietnameseWelshWest IndianYakamaYaquiYugoslavianYumanYup'ikZimbabwean
Immigration
NonimmigrantsImmigrantsAfghanistanAfricaAlbaniaArgentinaArmeniaAsiaAustraliaAustriaBahamasBangladeshBarbadosBelarusBelgiumBelizeBoliviaBosnia and HerzegovinaBrazilBulgariaBurma/MyanmarCabo VerdeCambodiaCameroonCanadaCaribbeanCentral AmericaChileChinaColombiaCongoCosta RicaCroatiaCubaCzechoslovakiaDenmarkDominicaDominican RepublicEastern AfricaEastern AsiaEastern EuropeEcuadorEgyptEl SalvadorEnglandEritreaEthiopiaEuropeFijiFranceGermanyGhanaGreeceGrenadaGuatemalaGuyanaHaitiHondurasHong KongHungaryIndiaIndonesiaIranIraqIrelandIsraelItalyJamaicaJapanJordanKazakhstanKenyaKoreaKuwaitLaosLatin AmericaLatviaLebanonLiberiaLithuaniaMalaysiaMexicoMicronesiaMiddle AfricaMoldovaMoroccoNepalNetherlandsNicaraguaNigeriaNorth AmericaNorth MacedoniaNorthern AfricaNorthern EuropeNorwayOceaniaPakistanPanamaPeruPhilippinesPolandPortugalRomaniaRussiaSaudi ArabiaScotlandSenegalSerbiaSierra LeoneSingaporeSomaliaSouth AfricaSouth AmericaSouth Central AsiaSouth Eastern AsiaSouthern EuropeSpainSri LankaSt. Vincent and the GrenadinesSudanSwedenSwitzerlandSyriaTaiwanThailandTrinidad and TobagoTurkeyUgandaUkraineUruguayUzbekistanVenezuelaVietnamWest IndiesWestern AfricaWestern AsiaWestern EuropeYemenZaireZimbabweAzores
Swedish
Race
Ancestry
AfghanAfricanAlaska NativeAlaskan AthabascanAlbanianAleutAlsatianAmericanApacheArabArapahoArgentineanArmenianAssyrian/Chaldean/SyriacAustralianAustrianBahamianBangladeshiBarbadianBasqueBelgianBelizeanBermudanBhutaneseBlackfeetBolivianBrazilianBritishBritish West IndianBulgarianBurmeseCajunCambodianCanadianCape VerdeanCarpatho RusynCelticCentral AmericanCentral American IndianCherokeeCheyenneChickasawChileanChineseChippewaChoctawColombianColvilleComancheCosta RicanCreeCreekCroatianCrowCubanCypriotCzechCzechoslovakianDanishDelawareDominicanDutchDutch West IndianEastern EuropeanEcuadorianEgyptianEnglishEstonianEthiopianEuropeanFijianFilipinoFrenchFrench American IndianFrench CanadianGermanGerman RussianGhanaianGreekGuamanian/ChamorroGuatemalanGuyaneseHaitianHmongHonduranHopiHoumaHungarianIcelanderIndian (Asian)IndonesianInupiatIranianIraqiIrishIroquoisIsraeliItalianJamaicanJapaneseJordanianKenyanKiowaKoreanLaotianLatvianLebaneseLiberianLithuanianLumbeeLuxembourgerMacedonianMalaysianMalteseMarshalleseMenomineeMexicanMexican American IndianMongolianMoroccanNative HawaiianNavajoNepaleseNew ZealanderNicaraguanNigerianNorthern EuropeanNorwegianOkinawanOsageOttawaPaiutePakistaniPalestinianPanamanianParaguayanPennsylvania GermanPeruvianPimaPolishPortuguesePotawatomiPuebloPuerto RicanPuget Sound SalishRomanianRussianSalvadoranSamoanScandinavianScotch-IrishScottishSeminoleSenegaleseSerbianShoshoneSierra LeoneanSiouxSlavicSlovakSloveneSomaliSouth AfricanSouth AmericanSouth American IndianSoviet UnionSpaniardSpanishSpanish AmericanSpanish American IndianSri LankanSubsaharan AfricanSudaneseSwedishSwissSyrianTaiwaneseThaiTlingit-HaidaTohono O'OdhamTonganTrinidadian and TobagonianTsimshianTurkishU.S. Virgin IslanderUgandanUkrainianUruguayanUteVenezuelanVietnameseWelshWest IndianYakamaYaquiYugoslavianYumanYup'ikZimbabwean
Immigration
NonimmigrantsImmigrantsAfghanistanAfricaAlbaniaArgentinaArmeniaAsiaAustraliaAustriaBahamasBangladeshBarbadosBelarusBelgiumBelizeBoliviaBosnia and HerzegovinaBrazilBulgariaBurma/MyanmarCabo VerdeCambodiaCameroonCanadaCaribbeanCentral AmericaChileChinaColombiaCongoCosta RicaCroatiaCubaCzechoslovakiaDenmarkDominicaDominican RepublicEastern AfricaEastern AsiaEastern EuropeEcuadorEgyptEl SalvadorEnglandEritreaEthiopiaEuropeFijiFranceGermanyGhanaGreeceGrenadaGuatemalaGuyanaHaitiHondurasHong KongHungaryIndiaIndonesiaIranIraqIrelandIsraelItalyJamaicaJapanJordanKazakhstanKenyaKoreaKuwaitLaosLatin AmericaLatviaLebanonLiberiaLithuaniaMalaysiaMexicoMicronesiaMiddle AfricaMoldovaMoroccoNepalNetherlandsNicaraguaNigeriaNorth AmericaNorth MacedoniaNorthern AfricaNorthern EuropeNorwayOceaniaPakistanPanamaPeruPhilippinesPolandPortugalRomaniaRussiaSaudi ArabiaScotlandSenegalSerbiaSierra LeoneSingaporeSomaliaSouth AfricaSouth AmericaSouth Central AsiaSouth Eastern AsiaSouthern EuropeSpainSri LankaSt. Vincent and the GrenadinesSudanSwedenSwitzerlandSyriaTaiwanThailandTrinidad and TobagoTurkeyUgandaUkraineUruguayUzbekistanVenezuelaVietnamWest IndiesWestern AfricaWestern AsiaWestern EuropeYemenZaireZimbabweAzores
Female Poverty Among 25-34 Year Olds
Income
Poverty
Unemployment
Labor Participation
Family Structure
Vehicle Availability
Education Level
Disability

Female Poverty Among 25-34 Year Olds Comparison

Finns

Swedes

Fair
Exceptional
13.7%
FEMALE POVERTY AMONG 25-34 YEAR OLDS
32.5/ 100
METRIC RATING
189th/ 347
METRIC RANK
12.7%
FEMALE POVERTY AMONG 25-34 YEAR OLDS
95.4/ 100
METRIC RATING
104th/ 347
METRIC RANK

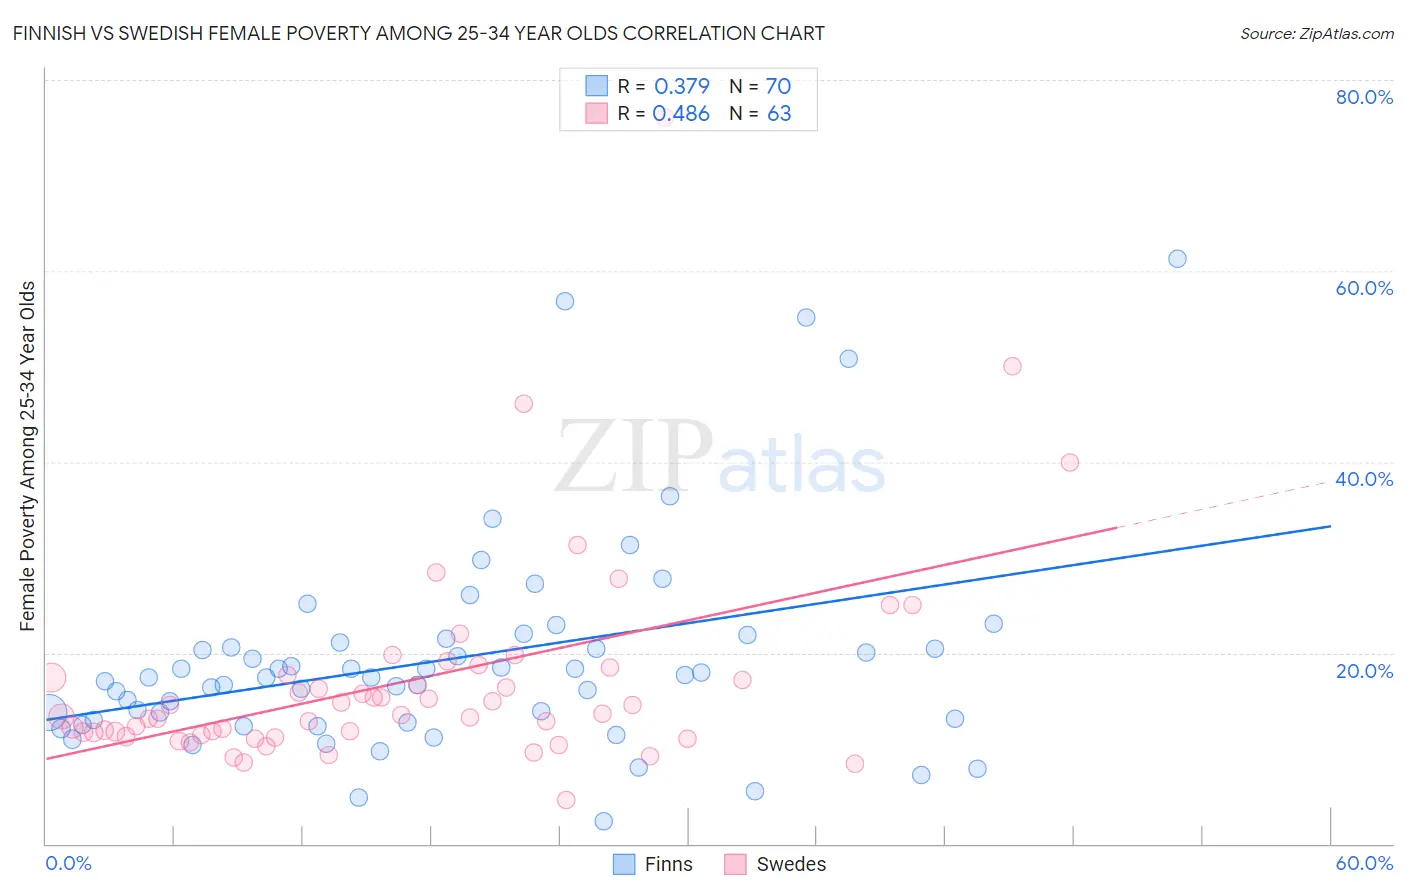
Finnish vs Swedish Female Poverty Among 25-34 Year Olds Correlation Chart

The statistical analysis conducted on geographies consisting of 396,136,684 people shows a mild positive correlation between the proportion of Finns and poverty level among females between the ages 25 and 34 in the United States with a correlation coefficient (R) of 0.379 and weighted average of 13.7%. Similarly, the statistical analysis conducted on geographies consisting of 520,171,676 people shows a moderate positive correlation between the proportion of Swedes and poverty level among females between the ages 25 and 34 in the United States with a correlation coefficient (R) of 0.486 and weighted average of 12.7%, a difference of 8.3%.
Finnish vs Swedish Female Poverty Among 25-34 Year Olds

Female Poverty Among 25-34 Year Olds Correlation Summary

MeasurementFinnishSwedish
Minimum2.4%4.6%
Maximum61.2%76.1%
Range58.8%71.5%
Mean19.4%17.0%
Median17.4%13.4%
Interquartile 25% (IQ1)12.9%11.3%
Interquartile 75% (IQ3)21.1%17.7%
Interquartile Range (IQR)8.2%6.3%
Standard Deviation (Sample)11.1%11.3%
Standard Deviation (Population)11.1%11.2%

Similar Demographics by Female Poverty Among 25-34 Year Olds

Demographics Similar to Finns by Female Poverty Among 25-34 Year Olds

In terms of female poverty among 25-34 year olds, the demographic groups most similar to Finns are Immigrants from Eritrea (13.7%, a difference of 0.020%), Immigrants from Uruguay (13.7%, a difference of 0.15%), Slovak (13.7%, a difference of 0.15%), Irish (13.7%, a difference of 0.26%), and Dutch (13.8%, a difference of 0.26%).
DemographicsRating | RankFemale Poverty Among 25-34 Year Olds
Immigrants | Venezuela
40.7
/100
|
#182
Average
13.6%
Portuguese
40.3
/100
|
#183
Average
13.6%
Czechoslovakians
36.8
/100
|
#184
Fair
13.7%
Irish
35.3
/100
|
#185
Fair
13.7%
Immigrants | Uruguay
34.1
/100
|
#186
Fair
13.7%
Slovaks
34.1
/100
|
#187
Fair
13.7%
Immigrants | Eritrea
32.7
/100
|
#188
Fair
13.7%
Finns
32.5
/100
|
#189
Fair
13.7%
Dutch
29.7
/100
|
#190
Fair
13.8%
Immigrants | St. Vincent and the Grenadines
29.3
/100
|
#191
Fair
13.8%
Tlingit-Haida
28.1
/100
|
#192
Fair
13.8%
Immigrants | Kenya
28.0
/100
|
#193
Fair
13.8%
Moroccans
25.1
/100
|
#194
Fair
13.8%
Immigrants | Cambodia
24.0
/100
|
#195
Fair
13.9%
Scottish
23.6
/100
|
#196
Fair
13.9%

Demographics Similar to Swedes by Female Poverty Among 25-34 Year Olds

In terms of female poverty among 25-34 year olds, the demographic groups most similar to Swedes are Immigrants from Spain (12.7%, a difference of 0.050%), Immigrants from South Africa (12.7%, a difference of 0.050%), Peruvian (12.7%, a difference of 0.11%), Tsimshian (12.7%, a difference of 0.15%), and Immigrants from Switzerland (12.7%, a difference of 0.17%).
DemographicsRating | RankFemale Poverty Among 25-34 Year Olds
Immigrants | Northern Africa
96.6
/100
|
#97
Exceptional
12.6%
Immigrants | Ethiopia
96.5
/100
|
#98
Exceptional
12.6%
Immigrants | Argentina
96.4
/100
|
#99
Exceptional
12.6%
Immigrants | Denmark
95.7
/100
|
#100
Exceptional
12.7%
Immigrants | Switzerland
95.7
/100
|
#101
Exceptional
12.7%
Peruvians
95.6
/100
|
#102
Exceptional
12.7%
Immigrants | Spain
95.5
/100
|
#103
Exceptional
12.7%
Swedes
95.4
/100
|
#104
Exceptional
12.7%
Immigrants | South Africa
95.3
/100
|
#105
Exceptional
12.7%
Tsimshian
95.1
/100
|
#106
Exceptional
12.7%
Poles
94.9
/100
|
#107
Exceptional
12.7%
Immigrants | Norway
94.4
/100
|
#108
Exceptional
12.7%
Immigrants | Peru
94.3
/100
|
#109
Exceptional
12.7%
Australians
94.1
/100
|
#110
Exceptional
12.8%
Danes
93.9
/100
|
#111
Exceptional
12.8%