Finnish vs Spanish American Indian Single Father Poverty
COMPARE
Finnish
Spanish American Indian
Single Father Poverty
Single Father Poverty Comparison
Finns
Spanish American Indians
16.9%
SINGLE FATHER POVERTY
2.6/ 100
METRIC RATING
240th/ 347
METRIC RANK
14.4%
SINGLE FATHER POVERTY
100.0/ 100
METRIC RATING
26th/ 347
METRIC RANK
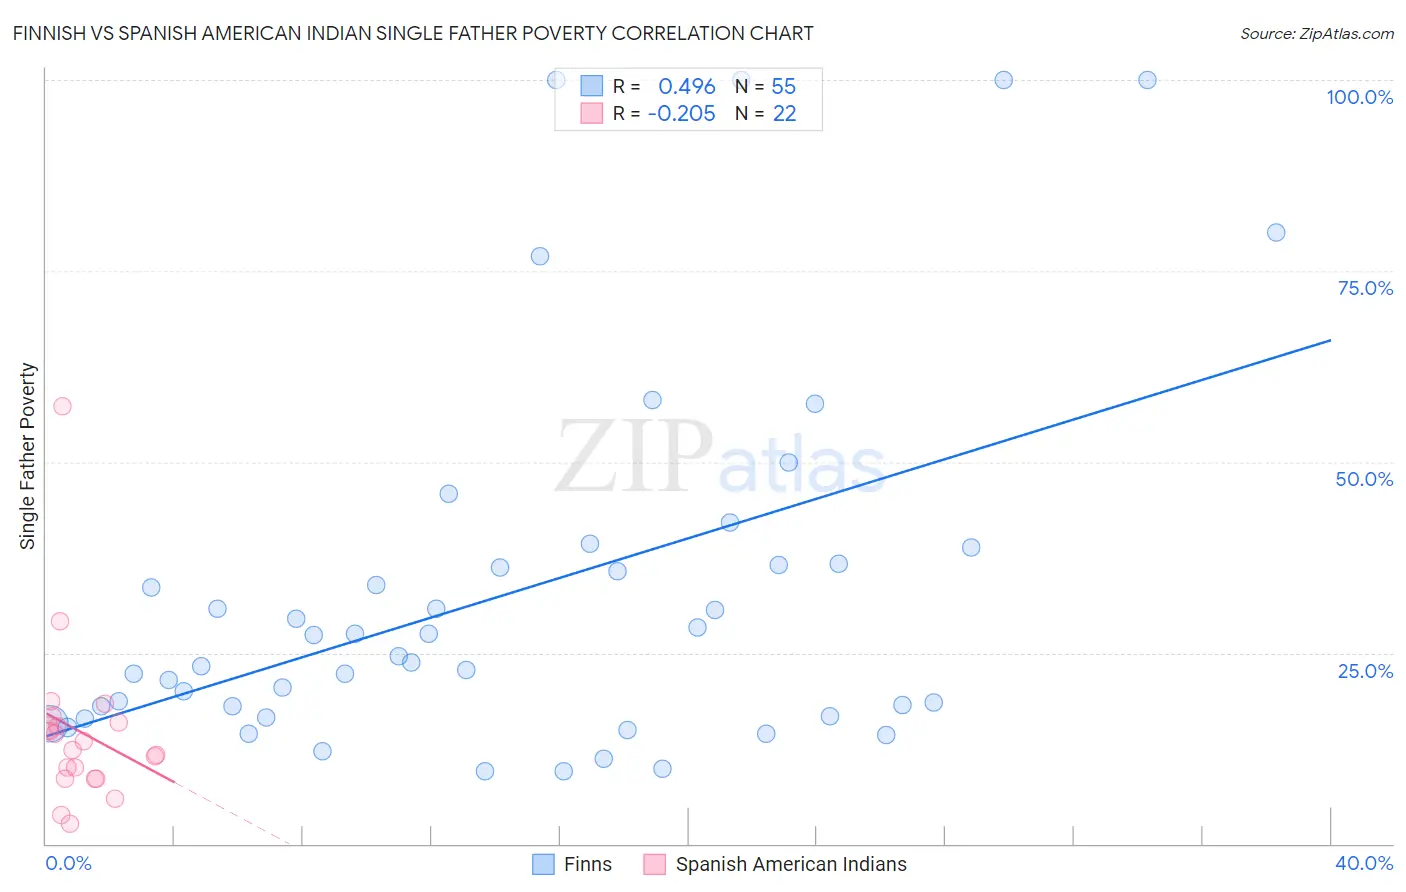
Finnish vs Spanish American Indian Single Father Poverty Correlation Chart
The statistical analysis conducted on geographies consisting of 310,078,024 people shows a moderate positive correlation between the proportion of Finns and poverty level among single fathers in the United States with a correlation coefficient (R) of 0.496 and weighted average of 16.9%. Similarly, the statistical analysis conducted on geographies consisting of 69,773,093 people shows a weak negative correlation between the proportion of Spanish American Indians and poverty level among single fathers in the United States with a correlation coefficient (R) of -0.205 and weighted average of 14.4%, a difference of 17.5%.
Single Father Poverty Correlation Summary
| Measurement | Finnish | Spanish American Indian |
| Minimum | 9.5% | 2.6% |
| Maximum | 100.0% | 57.2% |
| Range | 90.5% | 54.6% |
| Mean | 33.0% | 14.6% |
| Median | 24.5% | 12.9% |
| Interquartile 25% (IQ1) | 16.7% | 8.5% |
| Interquartile 75% (IQ3) | 36.6% | 15.8% |
| Interquartile Range (IQR) | 20.0% | 7.3% |
| Standard Deviation (Sample) | 24.2% | 11.1% |
| Standard Deviation (Population) | 24.0% | 10.8% |
Similar Demographics by Single Father Poverty
Demographics Similar to Finns by Single Father Poverty
In terms of single father poverty, the demographic groups most similar to Finns are Bermudan (16.9%, a difference of 0.010%), Immigrants from Saudi Arabia (16.9%, a difference of 0.030%), Immigrants from Western Europe (16.9%, a difference of 0.10%), Immigrants from Germany (16.9%, a difference of 0.10%), and Subsaharan African (16.9%, a difference of 0.10%).
| Demographics | Rating | Rank | Single Father Poverty |
| Senegalese | 3.2 /100 | #233 | Tragic 16.9% |
| Marshallese | 3.1 /100 | #234 | Tragic 16.9% |
| Immigrants | Western Europe | 2.9 /100 | #235 | Tragic 16.9% |
| Immigrants | Germany | 2.9 /100 | #236 | Tragic 16.9% |
| Sub-Saharan Africans | 2.9 /100 | #237 | Tragic 16.9% |
| Immigrants | Saudi Arabia | 2.7 /100 | #238 | Tragic 16.9% |
| Bermudans | 2.6 /100 | #239 | Tragic 16.9% |
| Finns | 2.6 /100 | #240 | Tragic 16.9% |
| Czechs | 2.3 /100 | #241 | Tragic 17.0% |
| Moroccans | 2.1 /100 | #242 | Tragic 17.0% |
| Immigrants | Cabo Verde | 1.6 /100 | #243 | Tragic 17.0% |
| Hondurans | 1.6 /100 | #244 | Tragic 17.0% |
| Trinidadians and Tobagonians | 1.5 /100 | #245 | Tragic 17.0% |
| Immigrants | Ireland | 1.4 /100 | #246 | Tragic 17.1% |
| Greeks | 1.3 /100 | #247 | Tragic 17.1% |
Demographics Similar to Spanish American Indians by Single Father Poverty
In terms of single father poverty, the demographic groups most similar to Spanish American Indians are Nepalese (14.4%, a difference of 0.050%), Iranian (14.4%, a difference of 0.42%), Immigrants from Egypt (14.4%, a difference of 0.46%), Immigrants from South Eastern Asia (14.4%, a difference of 0.46%), and Immigrants from South Central Asia (14.5%, a difference of 0.58%).
| Demographics | Rating | Rank | Single Father Poverty |
| Immigrants | Iraq | 100.0 /100 | #19 | Exceptional 14.3% |
| Immigrants | Singapore | 100.0 /100 | #20 | Exceptional 14.3% |
| Immigrants | Afghanistan | 100.0 /100 | #21 | Exceptional 14.3% |
| Taiwanese | 100.0 /100 | #22 | Exceptional 14.3% |
| Immigrants | Egypt | 100.0 /100 | #23 | Exceptional 14.4% |
| Immigrants | South Eastern Asia | 100.0 /100 | #24 | Exceptional 14.4% |
| Iranians | 100.0 /100 | #25 | Exceptional 14.4% |
| Spanish American Indians | 100.0 /100 | #26 | Exceptional 14.4% |
| Nepalese | 100.0 /100 | #27 | Exceptional 14.4% |
| Immigrants | South Central Asia | 100.0 /100 | #28 | Exceptional 14.5% |
| Somalis | 100.0 /100 | #29 | Exceptional 14.5% |
| Thais | 100.0 /100 | #30 | Exceptional 14.5% |
| Icelanders | 100.0 /100 | #31 | Exceptional 14.5% |
| Asians | 100.0 /100 | #32 | Exceptional 14.6% |
| Okinawans | 100.0 /100 | #33 | Exceptional 14.6% |