Finnish vs Okinawan Seniors Poverty Over the Age of 65

COMPARE

Finnish
Race
Ancestry
AfghanAfricanAlaska NativeAlaskan AthabascanAlbanianAleutAlsatianAmericanApacheArabArapahoArgentineanArmenianAssyrian/Chaldean/SyriacAustralianAustrianBahamianBangladeshiBarbadianBasqueBelgianBelizeanBermudanBhutaneseBlackfeetBolivianBrazilianBritishBritish West IndianBulgarianBurmeseCajunCambodianCanadianCape VerdeanCarpatho RusynCelticCentral AmericanCentral American IndianCherokeeCheyenneChickasawChileanChineseChippewaChoctawColombianColvilleComancheCosta RicanCreeCreekCroatianCrowCubanCypriotCzechCzechoslovakianDanishDelawareDominicanDutchDutch West IndianEastern EuropeanEcuadorianEgyptianEnglishEstonianEthiopianEuropeanFijianFilipinoFinnishFrenchFrench American IndianFrench CanadianGermanGerman RussianGhanaianGreekGuamanian/ChamorroGuatemalanGuyaneseHaitianHmongHonduranHopiHoumaHungarianIcelanderIndian (Asian)IndonesianInupiatIranianIraqiIrishIroquoisIsraeliItalianJamaicanJapaneseJordanianKenyanKiowaKoreanLaotianLatvianLebaneseLiberianLithuanianLumbeeLuxembourgerMacedonianMalaysianMalteseMarshalleseMenomineeMexicanMexican American IndianMongolianMoroccanNative HawaiianNavajoNepaleseNew ZealanderNicaraguanNigerianNorthern EuropeanNorwegianOsageOttawaPaiutePakistaniPalestinianPanamanianParaguayanPennsylvania GermanPeruvianPimaPolishPortuguesePotawatomiPuebloPuerto RicanPuget Sound SalishRomanianRussianSalvadoranSamoanScandinavianScotch-IrishScottishSeminoleSenegaleseSerbianShoshoneSierra LeoneanSiouxSlavicSlovakSloveneSomaliSouth AfricanSouth AmericanSouth American IndianSoviet UnionSpaniardSpanishSpanish AmericanSpanish American IndianSri LankanSubsaharan AfricanSudaneseSwedishSwissSyrianTaiwaneseThaiTlingit-HaidaTohono O'OdhamTonganTrinidadian and TobagonianTsimshianTurkishU.S. Virgin IslanderUgandanUkrainianUruguayanUteVenezuelanVietnameseWelshWest IndianYakamaYaquiYugoslavianYumanYup'ikZimbabwean
Immigration
NonimmigrantsImmigrantsAfghanistanAfricaAlbaniaArgentinaArmeniaAsiaAustraliaAustriaBahamasBangladeshBarbadosBelarusBelgiumBelizeBoliviaBosnia and HerzegovinaBrazilBulgariaBurma/MyanmarCabo VerdeCambodiaCameroonCanadaCaribbeanCentral AmericaChileChinaColombiaCongoCosta RicaCroatiaCubaCzechoslovakiaDenmarkDominicaDominican RepublicEastern AfricaEastern AsiaEastern EuropeEcuadorEgyptEl SalvadorEnglandEritreaEthiopiaEuropeFijiFranceGermanyGhanaGreeceGrenadaGuatemalaGuyanaHaitiHondurasHong KongHungaryIndiaIndonesiaIranIraqIrelandIsraelItalyJamaicaJapanJordanKazakhstanKenyaKoreaKuwaitLaosLatin AmericaLatviaLebanonLiberiaLithuaniaMalaysiaMexicoMicronesiaMiddle AfricaMoldovaMoroccoNepalNetherlandsNicaraguaNigeriaNorth AmericaNorth MacedoniaNorthern AfricaNorthern EuropeNorwayOceaniaPakistanPanamaPeruPhilippinesPolandPortugalRomaniaRussiaSaudi ArabiaScotlandSenegalSerbiaSierra LeoneSingaporeSomaliaSouth AfricaSouth AmericaSouth Central AsiaSouth Eastern AsiaSouthern EuropeSpainSri LankaSt. Vincent and the GrenadinesSudanSwedenSwitzerlandSyriaTaiwanThailandTrinidad and TobagoTurkeyUgandaUkraineUruguayUzbekistanVenezuelaVietnamWest IndiesWestern AfricaWestern AsiaWestern EuropeYemenZaireZimbabweAzores
Okinawan
Race
Ancestry
AfghanAfricanAlaska NativeAlaskan AthabascanAlbanianAleutAlsatianAmericanApacheArabArapahoArgentineanArmenianAssyrian/Chaldean/SyriacAustralianAustrianBahamianBangladeshiBarbadianBasqueBelgianBelizeanBermudanBhutaneseBlackfeetBolivianBrazilianBritishBritish West IndianBulgarianBurmeseCajunCambodianCanadianCape VerdeanCarpatho RusynCelticCentral AmericanCentral American IndianCherokeeCheyenneChickasawChileanChineseChippewaChoctawColombianColvilleComancheCosta RicanCreeCreekCroatianCrowCubanCypriotCzechCzechoslovakianDanishDelawareDominicanDutchDutch West IndianEastern EuropeanEcuadorianEgyptianEnglishEstonianEthiopianEuropeanFijianFilipinoFrenchFrench American IndianFrench CanadianGermanGerman RussianGhanaianGreekGuamanian/ChamorroGuatemalanGuyaneseHaitianHmongHonduranHopiHoumaHungarianIcelanderIndian (Asian)IndonesianInupiatIranianIraqiIrishIroquoisIsraeliItalianJamaicanJapaneseJordanianKenyanKiowaKoreanLaotianLatvianLebaneseLiberianLithuanianLumbeeLuxembourgerMacedonianMalaysianMalteseMarshalleseMenomineeMexicanMexican American IndianMongolianMoroccanNative HawaiianNavajoNepaleseNew ZealanderNicaraguanNigerianNorthern EuropeanNorwegianOkinawanOsageOttawaPaiutePakistaniPalestinianPanamanianParaguayanPennsylvania GermanPeruvianPimaPolishPortuguesePotawatomiPuebloPuerto RicanPuget Sound SalishRomanianRussianSalvadoranSamoanScandinavianScotch-IrishScottishSeminoleSenegaleseSerbianShoshoneSierra LeoneanSiouxSlavicSlovakSloveneSomaliSouth AfricanSouth AmericanSouth American IndianSoviet UnionSpaniardSpanishSpanish AmericanSpanish American IndianSri LankanSubsaharan AfricanSudaneseSwedishSwissSyrianTaiwaneseThaiTlingit-HaidaTohono O'OdhamTonganTrinidadian and TobagonianTsimshianTurkishU.S. Virgin IslanderUgandanUkrainianUruguayanUteVenezuelanVietnameseWelshWest IndianYakamaYaquiYugoslavianYumanYup'ikZimbabwean
Immigration
NonimmigrantsImmigrantsAfghanistanAfricaAlbaniaArgentinaArmeniaAsiaAustraliaAustriaBahamasBangladeshBarbadosBelarusBelgiumBelizeBoliviaBosnia and HerzegovinaBrazilBulgariaBurma/MyanmarCabo VerdeCambodiaCameroonCanadaCaribbeanCentral AmericaChileChinaColombiaCongoCosta RicaCroatiaCubaCzechoslovakiaDenmarkDominicaDominican RepublicEastern AfricaEastern AsiaEastern EuropeEcuadorEgyptEl SalvadorEnglandEritreaEthiopiaEuropeFijiFranceGermanyGhanaGreeceGrenadaGuatemalaGuyanaHaitiHondurasHong KongHungaryIndiaIndonesiaIranIraqIrelandIsraelItalyJamaicaJapanJordanKazakhstanKenyaKoreaKuwaitLaosLatin AmericaLatviaLebanonLiberiaLithuaniaMalaysiaMexicoMicronesiaMiddle AfricaMoldovaMoroccoNepalNetherlandsNicaraguaNigeriaNorth AmericaNorth MacedoniaNorthern AfricaNorthern EuropeNorwayOceaniaPakistanPanamaPeruPhilippinesPolandPortugalRomaniaRussiaSaudi ArabiaScotlandSenegalSerbiaSierra LeoneSingaporeSomaliaSouth AfricaSouth AmericaSouth Central AsiaSouth Eastern AsiaSouthern EuropeSpainSri LankaSt. Vincent and the GrenadinesSudanSwedenSwitzerlandSyriaTaiwanThailandTrinidad and TobagoTurkeyUgandaUkraineUruguayUzbekistanVenezuelaVietnamWest IndiesWestern AfricaWestern AsiaWestern EuropeYemenZaireZimbabweAzores
Seniors Poverty Over the Age of 65
Income
Poverty
Unemployment
Labor Participation
Family Structure
Vehicle Availability
Education Level
Disability

Seniors Poverty Over the Age of 65 Comparison

Finns

Okinawans

Exceptional
Exceptional
9.4%
SENIORS POVERTY OVER THE AGE OF 65
99.8/ 100
METRIC RATING
31st/ 347
METRIC RANK
10.4%
SENIORS POVERTY OVER THE AGE OF 65
91.7/ 100
METRIC RATING
118th/ 347
METRIC RANK

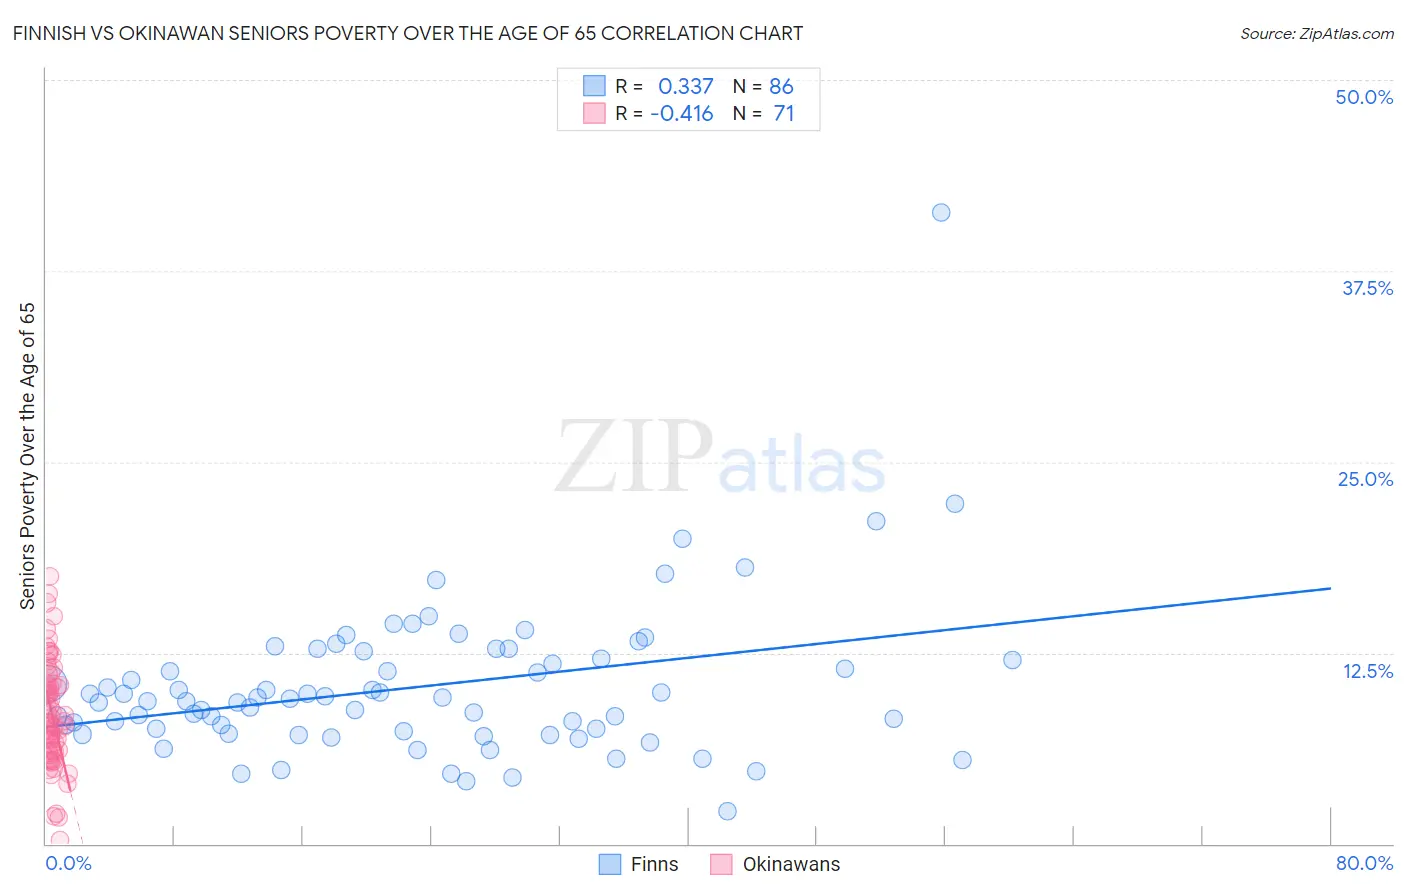
Finnish vs Okinawan Seniors Poverty Over the Age of 65 Correlation Chart

The statistical analysis conducted on geographies consisting of 403,117,006 people shows a mild positive correlation between the proportion of Finns and poverty level among seniors over the age of 65 in the United States with a correlation coefficient (R) of 0.337 and weighted average of 9.4%. Similarly, the statistical analysis conducted on geographies consisting of 73,626,507 people shows a moderate negative correlation between the proportion of Okinawans and poverty level among seniors over the age of 65 in the United States with a correlation coefficient (R) of -0.416 and weighted average of 10.4%, a difference of 10.3%.
Finnish vs Okinawan Seniors Poverty Over the Age of 65

Seniors Poverty Over the Age of 65 Correlation Summary

MeasurementFinnishOkinawan
Minimum2.1%0.21%
Maximum41.3%17.5%
Range39.2%17.3%
Mean10.3%8.5%
Median9.4%8.0%
Interquartile 25% (IQ1)7.4%6.0%
Interquartile 75% (IQ3)12.1%10.4%
Interquartile Range (IQR)4.7%4.4%
Standard Deviation (Sample)5.1%3.5%
Standard Deviation (Population)5.1%3.4%

Similar Demographics by Seniors Poverty Over the Age of 65

Demographics Similar to Finns by Seniors Poverty Over the Age of 65

In terms of seniors poverty over the age of 65, the demographic groups most similar to Finns are Menominee (9.4%, a difference of 0.22%), Northern European (9.4%, a difference of 0.28%), Native Hawaiian (9.4%, a difference of 0.30%), Bhutanese (9.3%, a difference of 0.37%), and British (9.4%, a difference of 0.40%).
DemographicsRating | RankSeniors Poverty Over the Age of 65
Bulgarians
99.9
/100
|
#24
Exceptional
9.3%
Irish
99.9
/100
|
#25
Exceptional
9.3%
Immigrants | Scotland
99.9
/100
|
#26
Exceptional
9.3%
Italians
99.9
/100
|
#27
Exceptional
9.3%
Tongans
99.9
/100
|
#28
Exceptional
9.3%
Bhutanese
99.9
/100
|
#29
Exceptional
9.3%
Menominee
99.8
/100
|
#30
Exceptional
9.4%
Finns
99.8
/100
|
#31
Exceptional
9.4%
Northern Europeans
99.8
/100
|
#32
Exceptional
9.4%
Native Hawaiians
99.8
/100
|
#33
Exceptional
9.4%
British
99.8
/100
|
#34
Exceptional
9.4%
Latvians
99.8
/100
|
#35
Exceptional
9.5%
Czechoslovakians
99.8
/100
|
#36
Exceptional
9.5%
Scotch-Irish
99.7
/100
|
#37
Exceptional
9.5%
Belgians
99.7
/100
|
#38
Exceptional
9.5%

Demographics Similar to Okinawans by Seniors Poverty Over the Age of 65

In terms of seniors poverty over the age of 65, the demographic groups most similar to Okinawans are Lebanese (10.3%, a difference of 0.080%), Pakistani (10.3%, a difference of 0.14%), Immigrants from Western Europe (10.4%, a difference of 0.19%), Immigrants from Bosnia and Herzegovina (10.4%, a difference of 0.26%), and Immigrants from Italy (10.3%, a difference of 0.29%).
DemographicsRating | RankSeniors Poverty Over the Age of 65
Immigrants | Belgium
93.4
/100
|
#111
Exceptional
10.3%
Immigrants | Korea
93.3
/100
|
#112
Exceptional
10.3%
Immigrants | Romania
93.3
/100
|
#113
Exceptional
10.3%
Immigrants | Denmark
92.7
/100
|
#114
Exceptional
10.3%
Immigrants | Italy
92.6
/100
|
#115
Exceptional
10.3%
Pakistanis
92.2
/100
|
#116
Exceptional
10.3%
Lebanese
92.0
/100
|
#117
Exceptional
10.3%
Okinawans
91.7
/100
|
#118
Exceptional
10.4%
Immigrants | Western Europe
91.1
/100
|
#119
Exceptional
10.4%
Immigrants | Bosnia and Herzegovina
90.8
/100
|
#120
Exceptional
10.4%
Immigrants | Iraq
90.7
/100
|
#121
Exceptional
10.4%
Immigrants | Moldova
90.7
/100
|
#122
Exceptional
10.4%
Hmong
90.0
/100
|
#123
Exceptional
10.4%
Asians
89.9
/100
|
#124
Excellent
10.4%
Immigrants | Philippines
89.4
/100
|
#125
Excellent
10.4%