Finnish vs Immigrants from Barbados Child Poverty Under the Age of 16
COMPARE
Finnish
Immigrants from Barbados
Child Poverty Under the Age of 16
Child Poverty Under the Age of 16 Comparison
Finns
Immigrants from Barbados
14.5%
CHILD POVERTY UNDER THE AGE OF 16
97.2/ 100
METRIC RATING
81st/ 347
METRIC RANK
19.9%
CHILD POVERTY UNDER THE AGE OF 16
0.1/ 100
METRIC RATING
275th/ 347
METRIC RANK
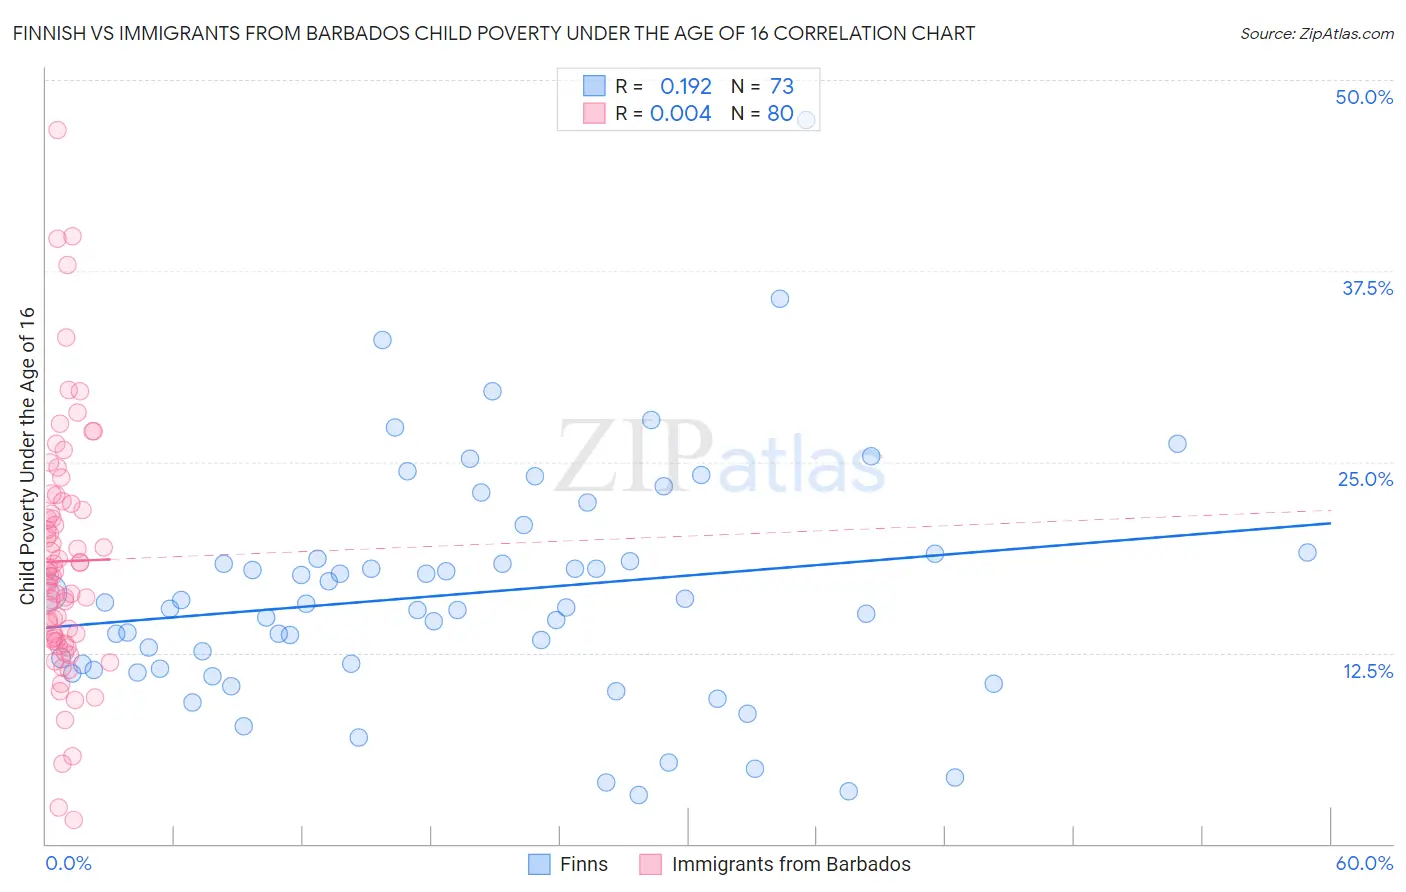
Finnish vs Immigrants from Barbados Child Poverty Under the Age of 16 Correlation Chart
The statistical analysis conducted on geographies consisting of 399,880,934 people shows a poor positive correlation between the proportion of Finns and poverty level among children under the age of 16 in the United States with a correlation coefficient (R) of 0.192 and weighted average of 14.5%. Similarly, the statistical analysis conducted on geographies consisting of 112,587,035 people shows no correlation between the proportion of Immigrants from Barbados and poverty level among children under the age of 16 in the United States with a correlation coefficient (R) of 0.004 and weighted average of 19.9%, a difference of 37.1%.
Child Poverty Under the Age of 16 Correlation Summary
| Measurement | Finnish | Immigrants from Barbados |
| Minimum | 3.2% | 1.6% |
| Maximum | 47.4% | 46.7% |
| Range | 44.1% | 45.2% |
| Mean | 16.4% | 18.5% |
| Median | 15.4% | 17.5% |
| Interquartile 25% (IQ1) | 11.4% | 13.3% |
| Interquartile 75% (IQ3) | 18.8% | 22.0% |
| Interquartile Range (IQR) | 7.4% | 8.7% |
| Standard Deviation (Sample) | 7.7% | 8.1% |
| Standard Deviation (Population) | 7.7% | 8.0% |
Similar Demographics by Child Poverty Under the Age of 16
Demographics Similar to Finns by Child Poverty Under the Age of 16
In terms of child poverty under the age of 16, the demographic groups most similar to Finns are Immigrants from North Macedonia (14.5%, a difference of 0.030%), Immigrants from Canada (14.5%, a difference of 0.030%), Egyptian (14.5%, a difference of 0.060%), Immigrants from Latvia (14.5%, a difference of 0.080%), and Swiss (14.5%, a difference of 0.10%).
| Demographics | Rating | Rank | Child Poverty Under the Age of 16 |
| Macedonians | 97.6 /100 | #74 | Exceptional 14.4% |
| Ukrainians | 97.5 /100 | #75 | Exceptional 14.4% |
| Immigrants | Eastern Europe | 97.5 /100 | #76 | Exceptional 14.4% |
| Australians | 97.5 /100 | #77 | Exceptional 14.4% |
| Immigrants | Russia | 97.3 /100 | #78 | Exceptional 14.5% |
| Swiss | 97.3 /100 | #79 | Exceptional 14.5% |
| Immigrants | North Macedonia | 97.2 /100 | #80 | Exceptional 14.5% |
| Finns | 97.2 /100 | #81 | Exceptional 14.5% |
| Immigrants | Canada | 97.2 /100 | #82 | Exceptional 14.5% |
| Egyptians | 97.2 /100 | #83 | Exceptional 14.5% |
| Immigrants | Latvia | 97.1 /100 | #84 | Exceptional 14.5% |
| Soviet Union | 97.1 /100 | #85 | Exceptional 14.5% |
| Immigrants | Argentina | 97.1 /100 | #86 | Exceptional 14.5% |
| Taiwanese | 97.1 /100 | #87 | Exceptional 14.5% |
| Northern Europeans | 97.0 /100 | #88 | Exceptional 14.5% |
Demographics Similar to Immigrants from Barbados by Child Poverty Under the Age of 16
In terms of child poverty under the age of 16, the demographic groups most similar to Immigrants from Barbados are Immigrants from Cabo Verde (19.9%, a difference of 0.0%), Belizean (19.9%, a difference of 0.0%), Iroquois (19.9%, a difference of 0.14%), Immigrants from Jamaica (19.8%, a difference of 0.16%), and Bangladeshi (19.9%, a difference of 0.24%).
| Demographics | Rating | Rank | Child Poverty Under the Age of 16 |
| Jamaicans | 0.1 /100 | #268 | Tragic 19.7% |
| Immigrants | El Salvador | 0.1 /100 | #269 | Tragic 19.7% |
| Spanish American Indians | 0.1 /100 | #270 | Tragic 19.7% |
| Immigrants | Liberia | 0.1 /100 | #271 | Tragic 19.7% |
| Immigrants | Bangladesh | 0.1 /100 | #272 | Tragic 19.8% |
| Immigrants | Jamaica | 0.1 /100 | #273 | Tragic 19.8% |
| Immigrants | Cabo Verde | 0.1 /100 | #274 | Tragic 19.9% |
| Immigrants | Barbados | 0.1 /100 | #275 | Tragic 19.9% |
| Belizeans | 0.1 /100 | #276 | Tragic 19.9% |
| Iroquois | 0.1 /100 | #277 | Tragic 19.9% |
| Bangladeshis | 0.0 /100 | #278 | Tragic 19.9% |
| Sub-Saharan Africans | 0.0 /100 | #279 | Tragic 19.9% |
| Comanche | 0.0 /100 | #280 | Tragic 19.9% |
| Central Americans | 0.0 /100 | #281 | Tragic 20.0% |
| Barbadians | 0.0 /100 | #282 | Tragic 20.0% |