Filipino vs Immigrants from Latin America Family Poverty
COMPARE
Filipino
Immigrants from Latin America
Family Poverty
Family Poverty Comparison
Filipinos
Immigrants from Latin America
6.6%
FAMILY POVERTY
100.0/ 100
METRIC RATING
4th/ 347
METRIC RANK
11.8%
FAMILY POVERTY
0.0/ 100
METRIC RATING
304th/ 347
METRIC RANK
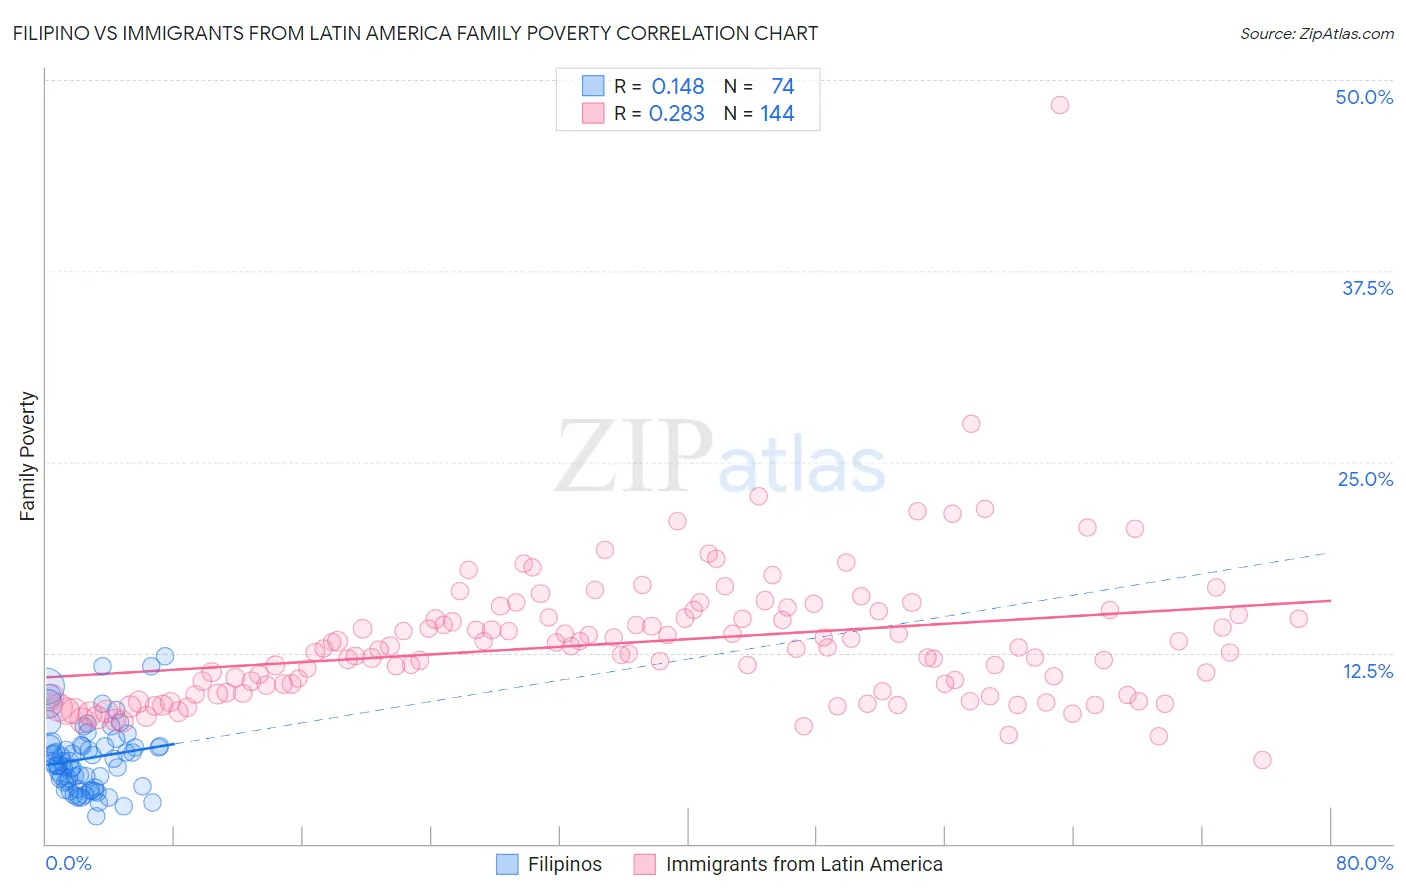
Filipino vs Immigrants from Latin America Family Poverty Correlation Chart
The statistical analysis conducted on geographies consisting of 253,803,740 people shows a poor positive correlation between the proportion of Filipinos and poverty level among families in the United States with a correlation coefficient (R) of 0.148 and weighted average of 6.6%. Similarly, the statistical analysis conducted on geographies consisting of 554,872,289 people shows a weak positive correlation between the proportion of Immigrants from Latin America and poverty level among families in the United States with a correlation coefficient (R) of 0.283 and weighted average of 11.8%, a difference of 77.4%.
Family Poverty Correlation Summary
| Measurement | Filipino | Immigrants from Latin America |
| Minimum | 1.8% | 5.5% |
| Maximum | 12.3% | 48.4% |
| Range | 10.4% | 42.9% |
| Mean | 5.6% | 13.2% |
| Median | 5.3% | 12.7% |
| Interquartile 25% (IQ1) | 3.7% | 9.8% |
| Interquartile 75% (IQ3) | 6.4% | 14.8% |
| Interquartile Range (IQR) | 2.7% | 5.0% |
| Standard Deviation (Sample) | 2.2% | 4.7% |
| Standard Deviation (Population) | 2.2% | 4.7% |
Similar Demographics by Family Poverty
Demographics Similar to Filipinos by Family Poverty
In terms of family poverty, the demographic groups most similar to Filipinos are Thai (6.7%, a difference of 0.57%), Immigrants from Taiwan (6.6%, a difference of 0.61%), Chinese (6.5%, a difference of 2.2%), Norwegian (6.9%, a difference of 3.6%), and Immigrants from Ireland (7.0%, a difference of 5.0%).
| Demographics | Rating | Rank | Family Poverty |
| Immigrants | India | 100.0 /100 | #1 | Exceptional 6.2% |
| Chinese | 100.0 /100 | #2 | Exceptional 6.5% |
| Immigrants | Taiwan | 100.0 /100 | #3 | Exceptional 6.6% |
| Filipinos | 100.0 /100 | #4 | Exceptional 6.6% |
| Thais | 100.0 /100 | #5 | Exceptional 6.7% |
| Norwegians | 99.9 /100 | #6 | Exceptional 6.9% |
| Immigrants | Ireland | 99.9 /100 | #7 | Exceptional 7.0% |
| Bhutanese | 99.9 /100 | #8 | Exceptional 7.0% |
| Latvians | 99.9 /100 | #9 | Exceptional 7.1% |
| Bulgarians | 99.8 /100 | #10 | Exceptional 7.1% |
| Immigrants | Singapore | 99.8 /100 | #11 | Exceptional 7.1% |
| Maltese | 99.8 /100 | #12 | Exceptional 7.1% |
| Swedes | 99.8 /100 | #13 | Exceptional 7.1% |
| Iranians | 99.8 /100 | #14 | Exceptional 7.1% |
| Lithuanians | 99.8 /100 | #15 | Exceptional 7.2% |
Demographics Similar to Immigrants from Latin America by Family Poverty
In terms of family poverty, the demographic groups most similar to Immigrants from Latin America are Mexican (11.8%, a difference of 0.18%), African (11.8%, a difference of 0.19%), Guatemalan (11.7%, a difference of 0.69%), Bahamian (11.7%, a difference of 0.73%), and Cajun (11.9%, a difference of 0.74%).
| Demographics | Rating | Rank | Family Poverty |
| Creek | 0.0 /100 | #297 | Tragic 11.7% |
| Immigrants | Senegal | 0.0 /100 | #298 | Tragic 11.7% |
| Dutch West Indians | 0.0 /100 | #299 | Tragic 11.7% |
| Immigrants | Bangladesh | 0.0 /100 | #300 | Tragic 11.7% |
| Bahamians | 0.0 /100 | #301 | Tragic 11.7% |
| Guatemalans | 0.0 /100 | #302 | Tragic 11.7% |
| Africans | 0.0 /100 | #303 | Tragic 11.8% |
| Immigrants | Latin America | 0.0 /100 | #304 | Tragic 11.8% |
| Mexicans | 0.0 /100 | #305 | Tragic 11.8% |
| Cajuns | 0.0 /100 | #306 | Tragic 11.9% |
| Immigrants | Congo | 0.0 /100 | #307 | Tragic 11.9% |
| Seminole | 0.0 /100 | #308 | Tragic 11.9% |
| Hispanics or Latinos | 0.0 /100 | #309 | Tragic 12.0% |
| Immigrants | Guatemala | 0.0 /100 | #310 | Tragic 12.0% |
| Ute | 0.0 /100 | #311 | Tragic 12.1% |