Fijian vs Immigrants from Netherlands Seniors Poverty Over the Age of 65
COMPARE
Fijian
Immigrants from Netherlands
Seniors Poverty Over the Age of 65
Seniors Poverty Over the Age of 65 Comparison
Fijians
Immigrants from Netherlands
10.7%
SENIORS POVERTY OVER THE AGE OF 65
75.6/ 100
METRIC RATING
153rd/ 347
METRIC RANK
9.9%
SENIORS POVERTY OVER THE AGE OF 65
98.7/ 100
METRIC RATING
66th/ 347
METRIC RANK
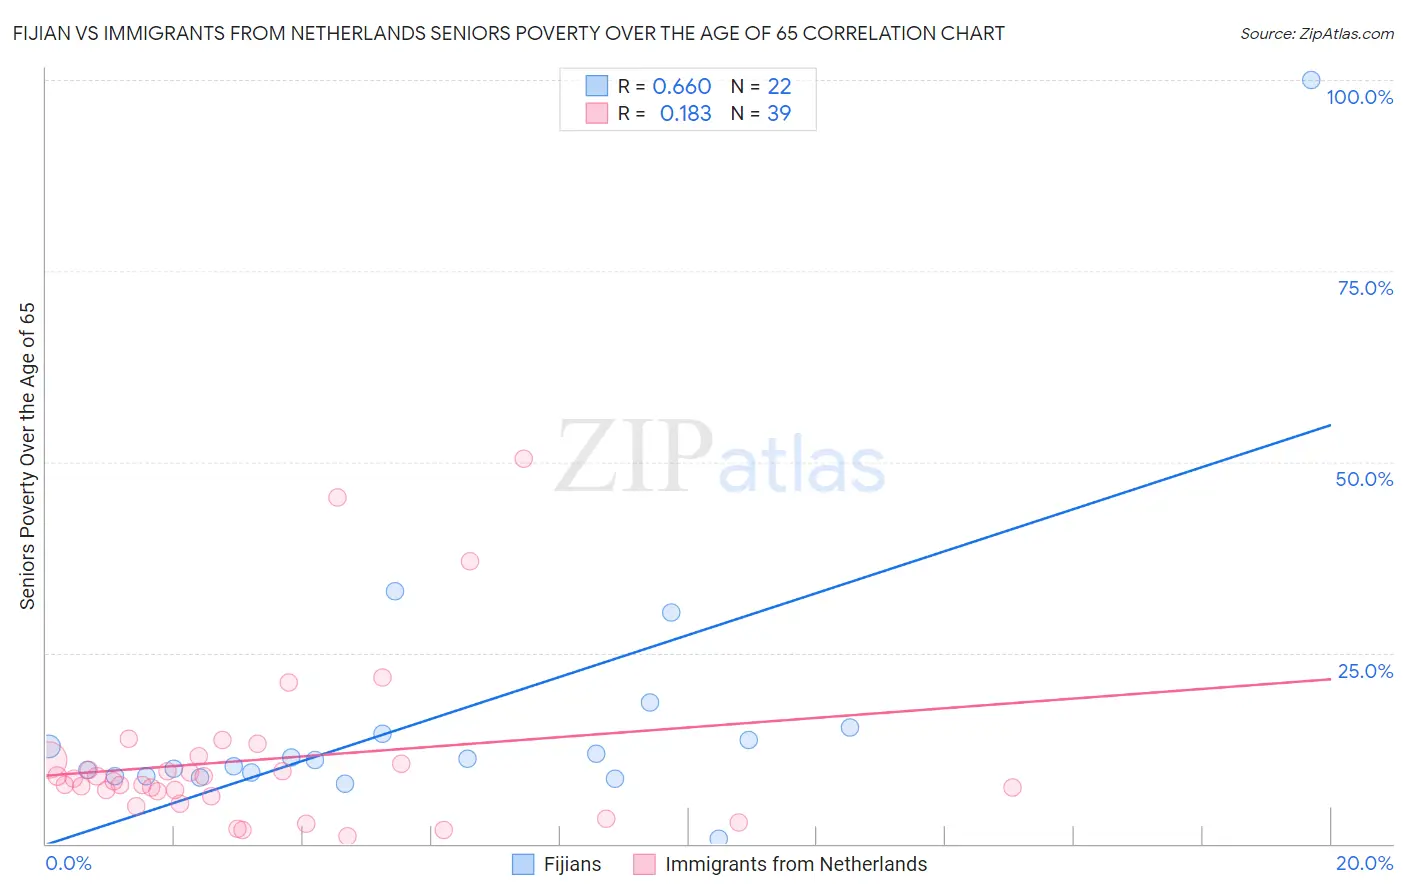
Fijian vs Immigrants from Netherlands Seniors Poverty Over the Age of 65 Correlation Chart
The statistical analysis conducted on geographies consisting of 55,831,768 people shows a significant positive correlation between the proportion of Fijians and poverty level among seniors over the age of 65 in the United States with a correlation coefficient (R) of 0.660 and weighted average of 10.7%. Similarly, the statistical analysis conducted on geographies consisting of 237,542,922 people shows a poor positive correlation between the proportion of Immigrants from Netherlands and poverty level among seniors over the age of 65 in the United States with a correlation coefficient (R) of 0.183 and weighted average of 9.9%, a difference of 7.8%.
Seniors Poverty Over the Age of 65 Correlation Summary
| Measurement | Fijian | Immigrants from Netherlands |
| Minimum | 0.60% | 1.0% |
| Maximum | 100.0% | 50.3% |
| Range | 99.4% | 49.3% |
| Mean | 16.6% | 11.0% |
| Median | 11.0% | 8.2% |
| Interquartile 25% (IQ1) | 8.9% | 6.3% |
| Interquartile 75% (IQ3) | 14.4% | 11.0% |
| Interquartile Range (IQR) | 5.5% | 4.8% |
| Standard Deviation (Sample) | 19.9% | 10.8% |
| Standard Deviation (Population) | 19.5% | 10.7% |
Similar Demographics by Seniors Poverty Over the Age of 65
Demographics Similar to Fijians by Seniors Poverty Over the Age of 65
In terms of seniors poverty over the age of 65, the demographic groups most similar to Fijians are Immigrants from Saudi Arabia (10.7%, a difference of 0.080%), Immigrants from Egypt (10.6%, a difference of 0.11%), Spanish (10.6%, a difference of 0.15%), Immigrants from Switzerland (10.6%, a difference of 0.22%), and Chickasaw (10.7%, a difference of 0.24%).
| Demographics | Rating | Rank | Seniors Poverty Over the Age of 65 |
| Alaskan Athabascans | 79.1 /100 | #146 | Good 10.6% |
| Immigrants | Greece | 79.0 /100 | #147 | Good 10.6% |
| Americans | 78.1 /100 | #148 | Good 10.6% |
| Immigrants | Cameroon | 78.1 /100 | #149 | Good 10.6% |
| Immigrants | Switzerland | 77.3 /100 | #150 | Good 10.6% |
| Spanish | 76.8 /100 | #151 | Good 10.6% |
| Immigrants | Egypt | 76.5 /100 | #152 | Good 10.6% |
| Fijians | 75.6 /100 | #153 | Good 10.7% |
| Immigrants | Saudi Arabia | 74.9 /100 | #154 | Good 10.7% |
| Chickasaw | 73.6 /100 | #155 | Good 10.7% |
| Ethiopians | 72.9 /100 | #156 | Good 10.7% |
| Immigrants | Ethiopia | 72.9 /100 | #157 | Good 10.7% |
| Immigrants | Sierra Leone | 71.7 /100 | #158 | Good 10.7% |
| Immigrants | Micronesia | 70.8 /100 | #159 | Good 10.7% |
| Sudanese | 68.2 /100 | #160 | Good 10.7% |
Demographics Similar to Immigrants from Netherlands by Seniors Poverty Over the Age of 65
In terms of seniors poverty over the age of 65, the demographic groups most similar to Immigrants from Netherlands are Pennsylvania German (9.9%, a difference of 0.050%), Immigrants from Austria (9.9%, a difference of 0.10%), Canadian (9.9%, a difference of 0.32%), Immigrants from North America (9.9%, a difference of 0.33%), and Macedonian (9.9%, a difference of 0.38%).
| Demographics | Rating | Rank | Seniors Poverty Over the Age of 65 |
| Immigrants | Canada | 99.0 /100 | #59 | Exceptional 9.8% |
| Celtics | 99.0 /100 | #60 | Exceptional 9.8% |
| Iranians | 98.9 /100 | #61 | Exceptional 9.8% |
| French Canadians | 98.9 /100 | #62 | Exceptional 9.8% |
| Macedonians | 98.8 /100 | #63 | Exceptional 9.9% |
| Immigrants | North America | 98.8 /100 | #64 | Exceptional 9.9% |
| Pennsylvania Germans | 98.7 /100 | #65 | Exceptional 9.9% |
| Immigrants | Netherlands | 98.7 /100 | #66 | Exceptional 9.9% |
| Immigrants | Austria | 98.6 /100 | #67 | Exceptional 9.9% |
| Canadians | 98.5 /100 | #68 | Exceptional 9.9% |
| Australians | 98.4 /100 | #69 | Exceptional 9.9% |
| Samoans | 98.0 /100 | #70 | Exceptional 10.0% |
| Yugoslavians | 97.9 /100 | #71 | Exceptional 10.0% |
| Palestinians | 97.9 /100 | #72 | Exceptional 10.0% |
| Russians | 97.9 /100 | #73 | Exceptional 10.0% |