European vs Immigrants from Sweden Single Father Poverty
COMPARE
European
Immigrants from Sweden
Single Father Poverty
Single Father Poverty Comparison
Europeans
Immigrants from Sweden
16.6%
SINGLE FATHER POVERTY
13.2/ 100
METRIC RATING
209th/ 347
METRIC RANK
15.2%
SINGLE FATHER POVERTY
99.8/ 100
METRIC RATING
63rd/ 347
METRIC RANK
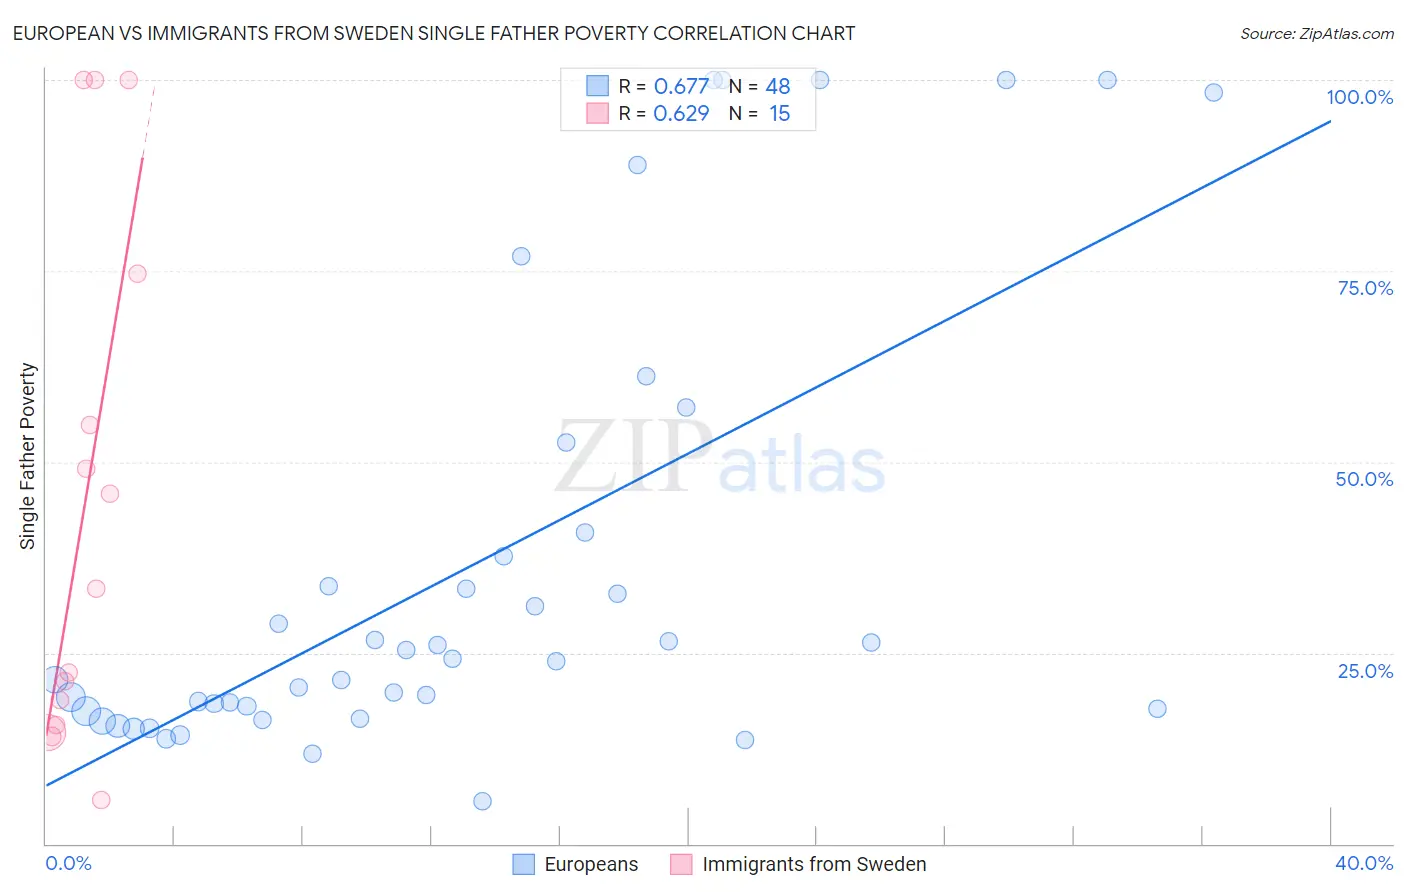
European vs Immigrants from Sweden Single Father Poverty Correlation Chart
The statistical analysis conducted on geographies consisting of 404,537,977 people shows a significant positive correlation between the proportion of Europeans and poverty level among single fathers in the United States with a correlation coefficient (R) of 0.677 and weighted average of 16.6%. Similarly, the statistical analysis conducted on geographies consisting of 139,123,706 people shows a significant positive correlation between the proportion of Immigrants from Sweden and poverty level among single fathers in the United States with a correlation coefficient (R) of 0.629 and weighted average of 15.2%, a difference of 9.6%.
Single Father Poverty Correlation Summary
| Measurement | European | Immigrants from Sweden |
| Minimum | 5.5% | 5.8% |
| Maximum | 100.0% | 100.0% |
| Range | 94.5% | 94.2% |
| Mean | 36.2% | 44.7% |
| Median | 24.1% | 33.3% |
| Interquartile 25% (IQ1) | 17.5% | 15.5% |
| Interquartile 75% (IQ3) | 39.2% | 74.7% |
| Interquartile Range (IQR) | 21.7% | 59.2% |
| Standard Deviation (Sample) | 29.2% | 34.1% |
| Standard Deviation (Population) | 28.9% | 32.9% |
Similar Demographics by Single Father Poverty
Demographics Similar to Europeans by Single Father Poverty
In terms of single father poverty, the demographic groups most similar to Europeans are Guatemalan (16.6%, a difference of 0.030%), Arab (16.6%, a difference of 0.030%), New Zealander (16.6%, a difference of 0.040%), Eastern European (16.6%, a difference of 0.040%), and Immigrants from Senegal (16.6%, a difference of 0.050%).
| Demographics | Rating | Rank | Single Father Poverty |
| Immigrants | Croatia | 16.5 /100 | #202 | Poor 16.6% |
| Immigrants | North America | 15.1 /100 | #203 | Poor 16.6% |
| Immigrants | Guatemala | 14.8 /100 | #204 | Poor 16.6% |
| Venezuelans | 14.3 /100 | #205 | Poor 16.6% |
| Immigrants | Senegal | 13.7 /100 | #206 | Poor 16.6% |
| New Zealanders | 13.7 /100 | #207 | Poor 16.6% |
| Eastern Europeans | 13.7 /100 | #208 | Poor 16.6% |
| Europeans | 13.2 /100 | #209 | Poor 16.6% |
| Guatemalans | 12.9 /100 | #210 | Poor 16.6% |
| Arabs | 12.8 /100 | #211 | Poor 16.6% |
| Immigrants | Southern Europe | 11.2 /100 | #212 | Poor 16.7% |
| Ghanaians | 11.0 /100 | #213 | Poor 16.7% |
| Spanish | 10.7 /100 | #214 | Poor 16.7% |
| Immigrants | Scotland | 9.6 /100 | #215 | Tragic 16.7% |
| Immigrants | England | 9.5 /100 | #216 | Tragic 16.7% |
Demographics Similar to Immigrants from Sweden by Single Father Poverty
In terms of single father poverty, the demographic groups most similar to Immigrants from Sweden are Bangladeshi (15.2%, a difference of 0.080%), Immigrants from Armenia (15.2%, a difference of 0.090%), Immigrants from Bosnia and Herzegovina (15.2%, a difference of 0.10%), Puget Sound Salish (15.2%, a difference of 0.14%), and Immigrants from Malaysia (15.2%, a difference of 0.16%).
| Demographics | Rating | Rank | Single Father Poverty |
| Immigrants | Laos | 99.9 /100 | #56 | Exceptional 15.1% |
| Laotians | 99.9 /100 | #57 | Exceptional 15.1% |
| Hawaiians | 99.9 /100 | #58 | Exceptional 15.1% |
| Guamanians/Chamorros | 99.9 /100 | #59 | Exceptional 15.1% |
| Puget Sound Salish | 99.8 /100 | #60 | Exceptional 15.2% |
| Immigrants | Bosnia and Herzegovina | 99.8 /100 | #61 | Exceptional 15.2% |
| Immigrants | Armenia | 99.8 /100 | #62 | Exceptional 15.2% |
| Immigrants | Sweden | 99.8 /100 | #63 | Exceptional 15.2% |
| Bangladeshis | 99.8 /100 | #64 | Exceptional 15.2% |
| Immigrants | Malaysia | 99.8 /100 | #65 | Exceptional 15.2% |
| Immigrants | Moldova | 99.8 /100 | #66 | Exceptional 15.2% |
| Paraguayans | 99.7 /100 | #67 | Exceptional 15.2% |
| Immigrants | Cameroon | 99.7 /100 | #68 | Exceptional 15.2% |
| Japanese | 99.7 /100 | #69 | Exceptional 15.2% |
| Mongolians | 99.7 /100 | #70 | Exceptional 15.3% |