Ethiopian vs Soviet Union Family Poverty
COMPARE
Ethiopian
Soviet Union
Family Poverty
Family Poverty Comparison
Ethiopians
Soviet Union
8.8%
FAMILY POVERTY
66.3/ 100
METRIC RATING
162nd/ 347
METRIC RANK
8.3%
FAMILY POVERTY
90.8/ 100
METRIC RATING
124th/ 347
METRIC RANK
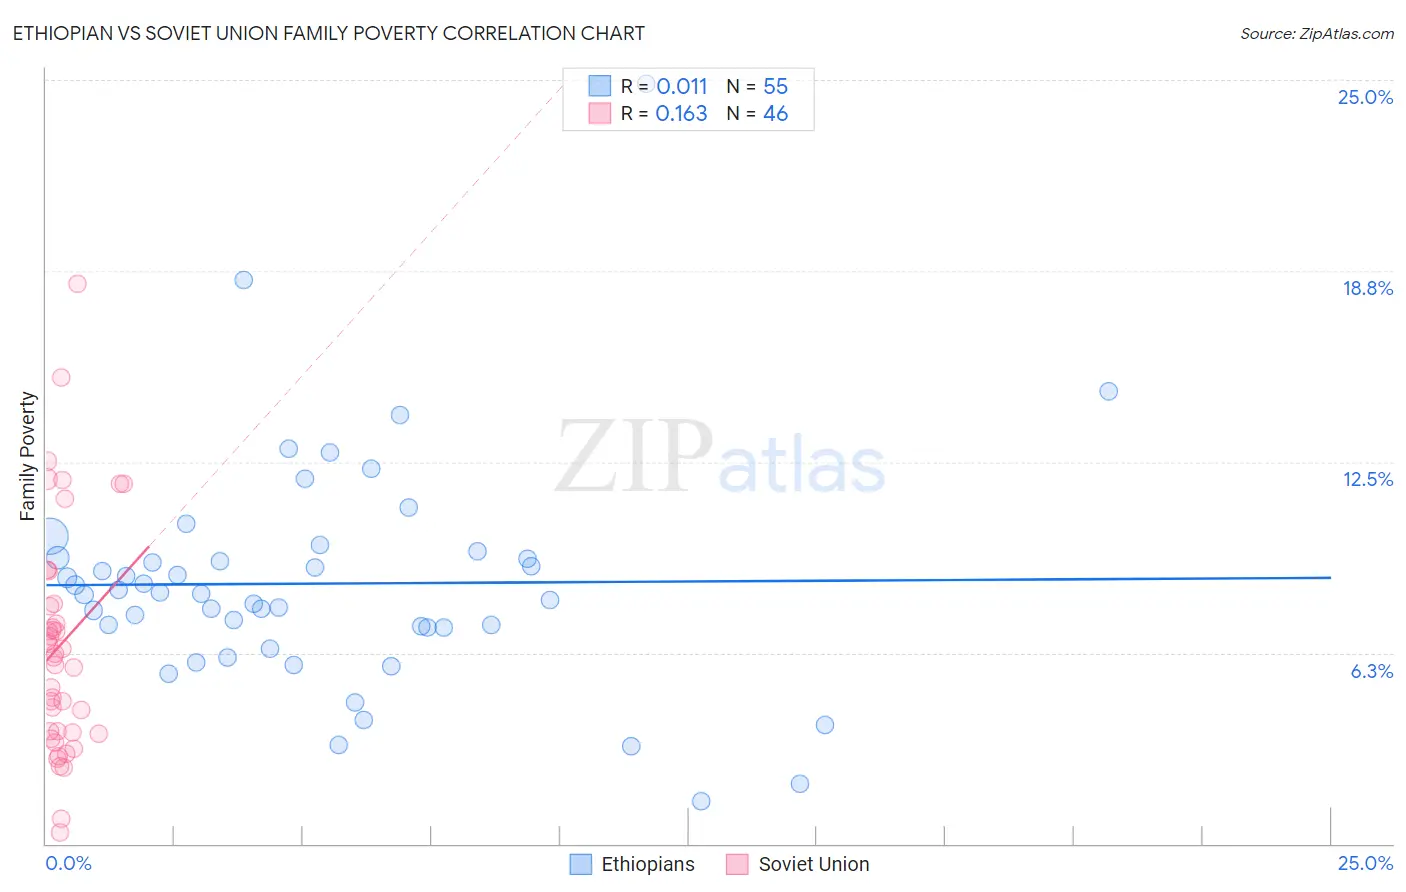
Ethiopian vs Soviet Union Family Poverty Correlation Chart
The statistical analysis conducted on geographies consisting of 222,923,037 people shows no correlation between the proportion of Ethiopians and poverty level among families in the United States with a correlation coefficient (R) of 0.011 and weighted average of 8.8%. Similarly, the statistical analysis conducted on geographies consisting of 43,439,449 people shows a poor positive correlation between the proportion of Soviet Union and poverty level among families in the United States with a correlation coefficient (R) of 0.163 and weighted average of 8.3%, a difference of 5.7%.
Family Poverty Correlation Summary
| Measurement | Ethiopian | Soviet Union |
| Minimum | 1.4% | 0.36% |
| Maximum | 24.9% | 18.3% |
| Range | 23.5% | 18.0% |
| Mean | 8.5% | 6.5% |
| Median | 8.2% | 6.2% |
| Interquartile 25% (IQ1) | 7.1% | 3.6% |
| Interquartile 75% (IQ3) | 9.4% | 7.9% |
| Interquartile Range (IQR) | 2.3% | 4.2% |
| Standard Deviation (Sample) | 3.8% | 3.8% |
| Standard Deviation (Population) | 3.8% | 3.7% |
Similar Demographics by Family Poverty
Demographics Similar to Ethiopians by Family Poverty
In terms of family poverty, the demographic groups most similar to Ethiopians are Pennsylvania German (8.8%, a difference of 0.050%), Immigrants from Northern Africa (8.8%, a difference of 0.090%), Hungarian (8.8%, a difference of 0.13%), Celtic (8.8%, a difference of 0.21%), and Guamanian/Chamorro (8.8%, a difference of 0.24%).
| Demographics | Rating | Rank | Family Poverty |
| Immigrants | Kuwait | 73.6 /100 | #155 | Good 8.7% |
| Immigrants | Oceania | 71.2 /100 | #156 | Good 8.7% |
| Tsimshian | 69.3 /100 | #157 | Good 8.8% |
| Whites/Caucasians | 69.1 /100 | #158 | Good 8.8% |
| Peruvians | 68.0 /100 | #159 | Good 8.8% |
| Hungarians | 67.2 /100 | #160 | Good 8.8% |
| Immigrants | Northern Africa | 66.9 /100 | #161 | Good 8.8% |
| Ethiopians | 66.3 /100 | #162 | Good 8.8% |
| Pennsylvania Germans | 66.0 /100 | #163 | Good 8.8% |
| Celtics | 64.9 /100 | #164 | Good 8.8% |
| Guamanians/Chamorros | 64.7 /100 | #165 | Good 8.8% |
| Afghans | 63.5 /100 | #166 | Good 8.8% |
| Immigrants | Ethiopia | 62.5 /100 | #167 | Good 8.9% |
| Israelis | 62.1 /100 | #168 | Good 8.9% |
| Immigrants | Chile | 59.6 /100 | #169 | Average 8.9% |
Demographics Similar to Soviet Union by Family Poverty
In terms of family poverty, the demographic groups most similar to Soviet Union are Pakistani (8.3%, a difference of 0.040%), Palestinian (8.3%, a difference of 0.10%), Paraguayan (8.3%, a difference of 0.17%), Native Hawaiian (8.3%, a difference of 0.18%), and Icelander (8.3%, a difference of 0.24%).
| Demographics | Rating | Rank | Family Poverty |
| Immigrants | Russia | 93.2 /100 | #117 | Exceptional 8.2% |
| Immigrants | Western Europe | 92.9 /100 | #118 | Exceptional 8.2% |
| French | 92.8 /100 | #119 | Exceptional 8.3% |
| Immigrants | Egypt | 91.6 /100 | #120 | Exceptional 8.3% |
| Native Hawaiians | 91.3 /100 | #121 | Exceptional 8.3% |
| Paraguayans | 91.2 /100 | #122 | Exceptional 8.3% |
| Palestinians | 91.1 /100 | #123 | Exceptional 8.3% |
| Soviet Union | 90.8 /100 | #124 | Exceptional 8.3% |
| Pakistanis | 90.8 /100 | #125 | Exceptional 8.3% |
| Icelanders | 90.3 /100 | #126 | Exceptional 8.3% |
| Immigrants | Hungary | 89.9 /100 | #127 | Excellent 8.4% |
| Argentineans | 89.6 /100 | #128 | Excellent 8.4% |
| Portuguese | 89.2 /100 | #129 | Excellent 8.4% |
| Immigrants | Bosnia and Herzegovina | 88.6 /100 | #130 | Excellent 8.4% |
| Puget Sound Salish | 88.6 /100 | #131 | Excellent 8.4% |