Ethiopian vs Immigrants from Sierra Leone Seniors Poverty Over the Age of 65

COMPARE

Ethiopian
Race
Ancestry
AfghanAfricanAlaska NativeAlaskan AthabascanAlbanianAleutAlsatianAmericanApacheArabArapahoArgentineanArmenianAssyrian/Chaldean/SyriacAustralianAustrianBahamianBangladeshiBarbadianBasqueBelgianBelizeanBermudanBhutaneseBlackfeetBolivianBrazilianBritishBritish West IndianBulgarianBurmeseCajunCambodianCanadianCape VerdeanCarpatho RusynCelticCentral AmericanCentral American IndianCherokeeCheyenneChickasawChileanChineseChippewaChoctawColombianColvilleComancheCosta RicanCreeCreekCroatianCrowCubanCypriotCzechCzechoslovakianDanishDelawareDominicanDutchDutch West IndianEastern EuropeanEcuadorianEgyptianEnglishEstonianEthiopianEuropeanFijianFilipinoFinnishFrenchFrench American IndianFrench CanadianGermanGerman RussianGhanaianGreekGuamanian/ChamorroGuatemalanGuyaneseHaitianHmongHonduranHopiHoumaHungarianIcelanderIndian (Asian)IndonesianInupiatIranianIraqiIrishIroquoisIsraeliItalianJamaicanJapaneseJordanianKenyanKiowaKoreanLaotianLatvianLebaneseLiberianLithuanianLumbeeLuxembourgerMacedonianMalaysianMalteseMarshalleseMenomineeMexicanMexican American IndianMongolianMoroccanNative HawaiianNavajoNepaleseNew ZealanderNicaraguanNigerianNorthern EuropeanNorwegianOkinawanOsageOttawaPaiutePakistaniPalestinianPanamanianParaguayanPennsylvania GermanPeruvianPimaPolishPortuguesePotawatomiPuebloPuerto RicanPuget Sound SalishRomanianRussianSalvadoranSamoanScandinavianScotch-IrishScottishSeminoleSenegaleseSerbianShoshoneSierra LeoneanSiouxSlavicSlovakSloveneSomaliSouth AfricanSouth AmericanSouth American IndianSoviet UnionSpaniardSpanishSpanish AmericanSpanish American IndianSri LankanSubsaharan AfricanSudaneseSwedishSwissSyrianTaiwaneseThaiTlingit-HaidaTohono O'OdhamTonganTrinidadian and TobagonianTsimshianTurkishU.S. Virgin IslanderUgandanUkrainianUruguayanUteVenezuelanVietnameseWelshWest IndianYakamaYaquiYugoslavianYumanYup'ikZimbabwean
Immigration
NonimmigrantsImmigrantsAfghanistanAfricaAlbaniaArgentinaArmeniaAsiaAustraliaAustriaBahamasBangladeshBarbadosBelarusBelgiumBelizeBoliviaBosnia and HerzegovinaBrazilBulgariaBurma/MyanmarCabo VerdeCambodiaCameroonCanadaCaribbeanCentral AmericaChileChinaColombiaCongoCosta RicaCroatiaCubaCzechoslovakiaDenmarkDominicaDominican RepublicEastern AfricaEastern AsiaEastern EuropeEcuadorEgyptEl SalvadorEnglandEritreaEthiopiaEuropeFijiFranceGermanyGhanaGreeceGrenadaGuatemalaGuyanaHaitiHondurasHong KongHungaryIndiaIndonesiaIranIraqIrelandIsraelItalyJamaicaJapanJordanKazakhstanKenyaKoreaKuwaitLaosLatin AmericaLatviaLebanonLiberiaLithuaniaMalaysiaMexicoMicronesiaMiddle AfricaMoldovaMoroccoNepalNetherlandsNicaraguaNigeriaNorth AmericaNorth MacedoniaNorthern AfricaNorthern EuropeNorwayOceaniaPakistanPanamaPeruPhilippinesPolandPortugalRomaniaRussiaSaudi ArabiaScotlandSenegalSerbiaSingaporeSomaliaSouth AfricaSouth AmericaSouth Central AsiaSouth Eastern AsiaSouthern EuropeSpainSri LankaSt. Vincent and the GrenadinesSudanSwedenSwitzerlandSyriaTaiwanThailandTrinidad and TobagoTurkeyUgandaUkraineUruguayUzbekistanVenezuelaVietnamWest IndiesWestern AfricaWestern AsiaWestern EuropeYemenZaireZimbabweAzores
Immigrants from Sierra Leone
Race
Ancestry
AfghanAfricanAlaska NativeAlaskan AthabascanAlbanianAleutAlsatianAmericanApacheArabArapahoArgentineanArmenianAssyrian/Chaldean/SyriacAustralianAustrianBahamianBangladeshiBarbadianBasqueBelgianBelizeanBermudanBhutaneseBlackfeetBolivianBrazilianBritishBritish West IndianBulgarianBurmeseCajunCambodianCanadianCape VerdeanCarpatho RusynCelticCentral AmericanCentral American IndianCherokeeCheyenneChickasawChileanChineseChippewaChoctawColombianColvilleComancheCosta RicanCreeCreekCroatianCrowCubanCypriotCzechCzechoslovakianDanishDelawareDominicanDutchDutch West IndianEastern EuropeanEcuadorianEgyptianEnglishEstonianEuropeanFijianFilipinoFinnishFrenchFrench American IndianFrench CanadianGermanGerman RussianGhanaianGreekGuamanian/ChamorroGuatemalanGuyaneseHaitianHmongHonduranHopiHoumaHungarianIcelanderIndian (Asian)IndonesianInupiatIranianIraqiIrishIroquoisIsraeliItalianJamaicanJapaneseJordanianKenyanKiowaKoreanLaotianLatvianLebaneseLiberianLithuanianLumbeeLuxembourgerMacedonianMalaysianMalteseMarshalleseMenomineeMexicanMexican American IndianMongolianMoroccanNative HawaiianNavajoNepaleseNew ZealanderNicaraguanNigerianNorthern EuropeanNorwegianOkinawanOsageOttawaPaiutePakistaniPalestinianPanamanianParaguayanPennsylvania GermanPeruvianPimaPolishPortuguesePotawatomiPuebloPuerto RicanPuget Sound SalishRomanianRussianSalvadoranSamoanScandinavianScotch-IrishScottishSeminoleSenegaleseSerbianShoshoneSierra LeoneanSiouxSlavicSlovakSloveneSomaliSouth AfricanSouth AmericanSouth American IndianSoviet UnionSpaniardSpanishSpanish AmericanSpanish American IndianSri LankanSubsaharan AfricanSudaneseSwedishSwissSyrianTaiwaneseThaiTlingit-HaidaTohono O'OdhamTonganTrinidadian and TobagonianTsimshianTurkishU.S. Virgin IslanderUgandanUkrainianUruguayanUteVenezuelanVietnameseWelshWest IndianYakamaYaquiYugoslavianYumanYup'ikZimbabwean
Immigration
NonimmigrantsImmigrantsAfghanistanAfricaAlbaniaArgentinaArmeniaAsiaAustraliaAustriaBahamasBangladeshBarbadosBelarusBelgiumBelizeBoliviaBosnia and HerzegovinaBrazilBulgariaBurma/MyanmarCabo VerdeCambodiaCameroonCanadaCaribbeanCentral AmericaChileChinaColombiaCongoCosta RicaCroatiaCubaCzechoslovakiaDenmarkDominicaDominican RepublicEastern AfricaEastern AsiaEastern EuropeEcuadorEgyptEl SalvadorEnglandEritreaEthiopiaEuropeFijiFranceGermanyGhanaGreeceGrenadaGuatemalaGuyanaHaitiHondurasHong KongHungaryIndiaIndonesiaIranIraqIrelandIsraelItalyJamaicaJapanJordanKazakhstanKenyaKoreaKuwaitLaosLatin AmericaLatviaLebanonLiberiaLithuaniaMalaysiaMexicoMicronesiaMiddle AfricaMoldovaMoroccoNepalNetherlandsNicaraguaNigeriaNorth AmericaNorth MacedoniaNorthern AfricaNorthern EuropeNorwayOceaniaPakistanPanamaPeruPhilippinesPolandPortugalRomaniaRussiaSaudi ArabiaScotlandSenegalSerbiaSierra LeoneSingaporeSomaliaSouth AfricaSouth AmericaSouth Central AsiaSouth Eastern AsiaSouthern EuropeSpainSri LankaSt. Vincent and the GrenadinesSudanSwedenSwitzerlandSyriaTaiwanThailandTrinidad and TobagoTurkeyUgandaUkraineUruguayUzbekistanVenezuelaVietnamWest IndiesWestern AfricaWestern AsiaWestern EuropeYemenZaireZimbabweAzores
Seniors Poverty Over the Age of 65
Income
Poverty
Unemployment
Labor Participation
Family Structure
Vehicle Availability
Education Level
Disability

Seniors Poverty Over the Age of 65 Comparison

Ethiopians

Immigrants from Sierra Leone

Good
Good
10.7%
SENIORS POVERTY OVER THE AGE OF 65
72.9/ 100
METRIC RATING
156th/ 347
METRIC RANK
10.7%
SENIORS POVERTY OVER THE AGE OF 65
71.7/ 100
METRIC RATING
158th/ 347
METRIC RANK

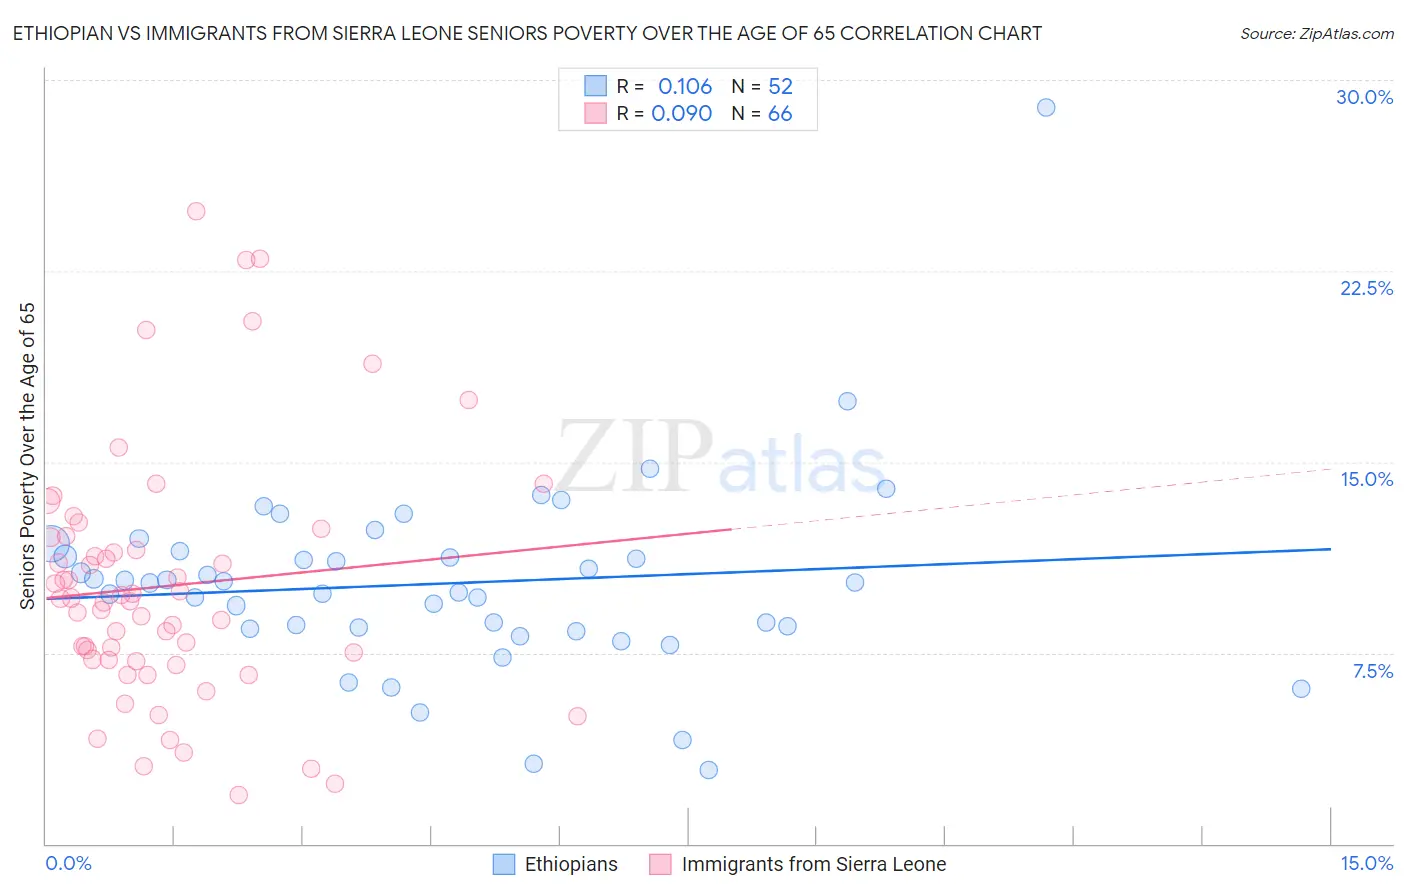
Ethiopian vs Immigrants from Sierra Leone Seniors Poverty Over the Age of 65 Correlation Chart

The statistical analysis conducted on geographies consisting of 222,742,361 people shows a poor positive correlation between the proportion of Ethiopians and poverty level among seniors over the age of 65 in the United States with a correlation coefficient (R) of 0.106 and weighted average of 10.7%. Similarly, the statistical analysis conducted on geographies consisting of 101,564,098 people shows a slight positive correlation between the proportion of Immigrants from Sierra Leone and poverty level among seniors over the age of 65 in the United States with a correlation coefficient (R) of 0.090 and weighted average of 10.7%, a difference of 0.15%.
Ethiopian vs Immigrants from Sierra Leone Seniors Poverty Over the Age of 65

Seniors Poverty Over the Age of 65 Correlation Summary

MeasurementEthiopianImmigrants from Sierra Leone
Minimum2.9%1.9%
Maximum28.9%24.8%
Range26.0%22.9%
Mean10.2%10.1%
Median10.3%9.6%
Interquartile 25% (IQ1)8.5%7.2%
Interquartile 75% (IQ3)11.4%12.0%
Interquartile Range (IQR)2.9%4.8%
Standard Deviation (Sample)3.9%4.9%
Standard Deviation (Population)3.8%4.9%

Demographics Similar to Ethiopians and Immigrants from Sierra Leone by Seniors Poverty Over the Age of 65

In terms of seniors poverty over the age of 65, the demographic groups most similar to Ethiopians are Immigrants from Ethiopia (10.7%, a difference of 0.010%), Chickasaw (10.7%, a difference of 0.070%), Immigrants from Saudi Arabia (10.7%, a difference of 0.23%), Immigrants from Micronesia (10.7%, a difference of 0.24%), and Fijian (10.7%, a difference of 0.31%). Similarly, the demographic groups most similar to Immigrants from Sierra Leone are Immigrants from Micronesia (10.7%, a difference of 0.10%), Immigrants from Ethiopia (10.7%, a difference of 0.14%), Chickasaw (10.7%, a difference of 0.22%), Sudanese (10.7%, a difference of 0.37%), and Immigrants from Saudi Arabia (10.7%, a difference of 0.38%).
DemographicsRating | RankSeniors Poverty Over the Age of 65
Immigrants | Greece
79.0
/100
|
#147
Good
10.6%
Americans
78.1
/100
|
#148
Good
10.6%
Immigrants | Cameroon
78.1
/100
|
#149
Good
10.6%
Immigrants | Switzerland
77.3
/100
|
#150
Good
10.6%
Spanish
76.8
/100
|
#151
Good
10.6%
Immigrants | Egypt
76.5
/100
|
#152
Good
10.6%
Fijians
75.6
/100
|
#153
Good
10.7%
Immigrants | Saudi Arabia
74.9
/100
|
#154
Good
10.7%
Chickasaw
73.6
/100
|
#155
Good
10.7%
Ethiopians
72.9
/100
|
#156
Good
10.7%
Immigrants | Ethiopia
72.9
/100
|
#157
Good
10.7%
Immigrants | Sierra Leone
71.7
/100
|
#158
Good
10.7%
Immigrants | Micronesia
70.8
/100
|
#159
Good
10.7%
Sudanese
68.2
/100
|
#160
Good
10.7%
Arabs
65.2
/100
|
#161
Good
10.8%
Immigrants | Indonesia
64.8
/100
|
#162
Good
10.8%
Tsimshian
64.5
/100
|
#163
Good
10.8%
Potawatomi
62.6
/100
|
#164
Good
10.8%
Immigrants | South Eastern Asia
62.1
/100
|
#165
Good
10.8%
Malaysians
62.0
/100
|
#166
Good
10.8%
Alaska Natives
60.3
/100
|
#167
Good
10.8%