Ethiopian vs Immigrants from Congo Female Poverty Among 25-34 Year Olds

COMPARE

Ethiopian
Race
Ancestry
AfghanAfricanAlaska NativeAlaskan AthabascanAlbanianAleutAlsatianAmericanApacheArabArapahoArgentineanArmenianAssyrian/Chaldean/SyriacAustralianAustrianBahamianBangladeshiBarbadianBasqueBelgianBelizeanBermudanBhutaneseBlackfeetBolivianBrazilianBritishBritish West IndianBulgarianBurmeseCajunCambodianCanadianCape VerdeanCarpatho RusynCelticCentral AmericanCentral American IndianCherokeeCheyenneChickasawChileanChineseChippewaChoctawColombianColvilleComancheCosta RicanCreeCreekCroatianCrowCubanCypriotCzechCzechoslovakianDanishDelawareDominicanDutchDutch West IndianEastern EuropeanEcuadorianEgyptianEnglishEstonianEthiopianEuropeanFijianFilipinoFinnishFrenchFrench American IndianFrench CanadianGermanGerman RussianGhanaianGreekGuamanian/ChamorroGuatemalanGuyaneseHaitianHmongHonduranHopiHoumaHungarianIcelanderIndian (Asian)IndonesianInupiatIranianIraqiIrishIroquoisIsraeliItalianJamaicanJapaneseJordanianKenyanKiowaKoreanLaotianLatvianLebaneseLiberianLithuanianLumbeeLuxembourgerMacedonianMalaysianMalteseMarshalleseMenomineeMexicanMexican American IndianMongolianMoroccanNative HawaiianNavajoNepaleseNew ZealanderNicaraguanNigerianNorthern EuropeanNorwegianOkinawanOsageOttawaPaiutePakistaniPalestinianPanamanianParaguayanPennsylvania GermanPeruvianPimaPolishPortuguesePotawatomiPuebloPuerto RicanPuget Sound SalishRomanianRussianSalvadoranSamoanScandinavianScotch-IrishScottishSeminoleSenegaleseSerbianShoshoneSierra LeoneanSiouxSlavicSlovakSloveneSomaliSouth AfricanSouth AmericanSouth American IndianSoviet UnionSpaniardSpanishSpanish AmericanSpanish American IndianSri LankanSubsaharan AfricanSudaneseSwedishSwissSyrianTaiwaneseThaiTlingit-HaidaTohono O'OdhamTonganTrinidadian and TobagonianTsimshianTurkishU.S. Virgin IslanderUgandanUkrainianUruguayanUteVenezuelanVietnameseWelshWest IndianYakamaYaquiYugoslavianYumanYup'ikZimbabwean
Immigration
NonimmigrantsImmigrantsAfghanistanAfricaAlbaniaArgentinaArmeniaAsiaAustraliaAustriaBahamasBangladeshBarbadosBelarusBelgiumBelizeBoliviaBosnia and HerzegovinaBrazilBulgariaBurma/MyanmarCabo VerdeCambodiaCameroonCanadaCaribbeanCentral AmericaChileChinaColombiaCosta RicaCroatiaCubaCzechoslovakiaDenmarkDominicaDominican RepublicEastern AfricaEastern AsiaEastern EuropeEcuadorEgyptEl SalvadorEnglandEritreaEthiopiaEuropeFijiFranceGermanyGhanaGreeceGrenadaGuatemalaGuyanaHaitiHondurasHong KongHungaryIndiaIndonesiaIranIraqIrelandIsraelItalyJamaicaJapanJordanKazakhstanKenyaKoreaKuwaitLaosLatin AmericaLatviaLebanonLiberiaLithuaniaMalaysiaMexicoMicronesiaMiddle AfricaMoldovaMoroccoNepalNetherlandsNicaraguaNigeriaNorth AmericaNorth MacedoniaNorthern AfricaNorthern EuropeNorwayOceaniaPakistanPanamaPeruPhilippinesPolandPortugalRomaniaRussiaSaudi ArabiaScotlandSenegalSerbiaSierra LeoneSingaporeSomaliaSouth AfricaSouth AmericaSouth Central AsiaSouth Eastern AsiaSouthern EuropeSpainSri LankaSt. Vincent and the GrenadinesSudanSwedenSwitzerlandSyriaTaiwanThailandTrinidad and TobagoTurkeyUgandaUkraineUruguayUzbekistanVenezuelaVietnamWest IndiesWestern AfricaWestern AsiaWestern EuropeYemenZaireZimbabweAzores
Immigrants from Congo
Race
Ancestry
AfghanAfricanAlaska NativeAlaskan AthabascanAlbanianAleutAlsatianAmericanApacheArabArapahoArgentineanArmenianAssyrian/Chaldean/SyriacAustralianAustrianBahamianBangladeshiBarbadianBasqueBelgianBelizeanBermudanBhutaneseBlackfeetBolivianBrazilianBritishBritish West IndianBulgarianBurmeseCajunCambodianCanadianCape VerdeanCarpatho RusynCelticCentral AmericanCentral American IndianCherokeeCheyenneChickasawChileanChineseChippewaChoctawColombianColvilleComancheCosta RicanCreeCreekCroatianCrowCubanCypriotCzechCzechoslovakianDanishDelawareDominicanDutchDutch West IndianEastern EuropeanEcuadorianEgyptianEnglishEstonianEuropeanFijianFilipinoFinnishFrenchFrench American IndianFrench CanadianGermanGerman RussianGhanaianGreekGuamanian/ChamorroGuatemalanGuyaneseHaitianHmongHonduranHopiHoumaHungarianIcelanderIndian (Asian)IndonesianInupiatIranianIraqiIrishIroquoisIsraeliItalianJamaicanJapaneseJordanianKenyanKiowaKoreanLaotianLatvianLebaneseLiberianLithuanianLumbeeLuxembourgerMacedonianMalaysianMalteseMarshalleseMenomineeMexicanMexican American IndianMongolianMoroccanNative HawaiianNavajoNepaleseNew ZealanderNicaraguanNigerianNorthern EuropeanNorwegianOkinawanOsageOttawaPaiutePakistaniPalestinianPanamanianParaguayanPennsylvania GermanPeruvianPimaPolishPortuguesePotawatomiPuebloPuerto RicanPuget Sound SalishRomanianRussianSalvadoranSamoanScandinavianScotch-IrishScottishSeminoleSenegaleseSerbianShoshoneSierra LeoneanSiouxSlavicSlovakSloveneSomaliSouth AfricanSouth AmericanSouth American IndianSoviet UnionSpaniardSpanishSpanish AmericanSpanish American IndianSri LankanSubsaharan AfricanSudaneseSwedishSwissSyrianTaiwaneseThaiTlingit-HaidaTohono O'OdhamTonganTrinidadian and TobagonianTsimshianTurkishU.S. Virgin IslanderUgandanUkrainianUruguayanUteVenezuelanVietnameseWelshWest IndianYakamaYaquiYugoslavianYumanYup'ikZimbabwean
Immigration
NonimmigrantsImmigrantsAfghanistanAfricaAlbaniaArgentinaArmeniaAsiaAustraliaAustriaBahamasBangladeshBarbadosBelarusBelgiumBelizeBoliviaBosnia and HerzegovinaBrazilBulgariaBurma/MyanmarCabo VerdeCambodiaCameroonCanadaCaribbeanCentral AmericaChileChinaColombiaCongoCosta RicaCroatiaCubaCzechoslovakiaDenmarkDominicaDominican RepublicEastern AfricaEastern AsiaEastern EuropeEcuadorEgyptEl SalvadorEnglandEritreaEthiopiaEuropeFijiFranceGermanyGhanaGreeceGrenadaGuatemalaGuyanaHaitiHondurasHong KongHungaryIndiaIndonesiaIranIraqIrelandIsraelItalyJamaicaJapanJordanKazakhstanKenyaKoreaKuwaitLaosLatin AmericaLatviaLebanonLiberiaLithuaniaMalaysiaMexicoMicronesiaMiddle AfricaMoldovaMoroccoNepalNetherlandsNicaraguaNigeriaNorth AmericaNorth MacedoniaNorthern AfricaNorthern EuropeNorwayOceaniaPakistanPanamaPeruPhilippinesPolandPortugalRomaniaRussiaSaudi ArabiaScotlandSenegalSerbiaSierra LeoneSingaporeSomaliaSouth AfricaSouth AmericaSouth Central AsiaSouth Eastern AsiaSouthern EuropeSpainSri LankaSt. Vincent and the GrenadinesSudanSwedenSwitzerlandSyriaTaiwanThailandTrinidad and TobagoTurkeyUgandaUkraineUruguayUzbekistanVenezuelaVietnamWest IndiesWestern AfricaWestern AsiaWestern EuropeYemenZaireZimbabweAzores
Female Poverty Among 25-34 Year Olds
Income
Poverty
Unemployment
Labor Participation
Family Structure
Vehicle Availability
Education Level
Disability

Female Poverty Among 25-34 Year Olds Comparison

Ethiopians

Immigrants from Congo

Exceptional
Tragic
12.4%
FEMALE POVERTY AMONG 25-34 YEAR OLDS
98.0/ 100
METRIC RATING
82nd/ 347
METRIC RANK
16.7%
FEMALE POVERTY AMONG 25-34 YEAR OLDS
0.0/ 100
METRIC RATING
301st/ 347
METRIC RANK

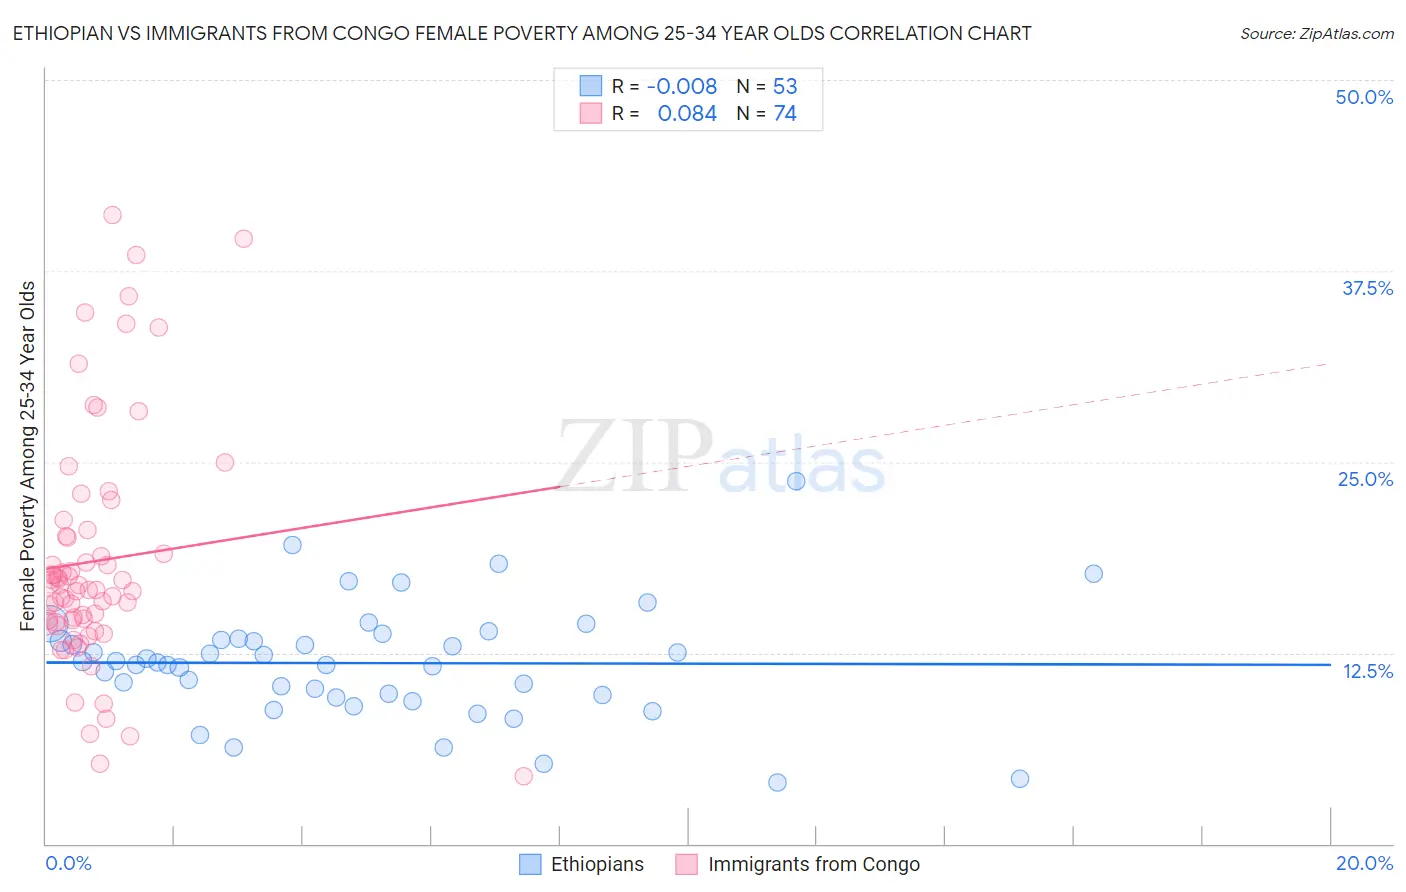
Ethiopian vs Immigrants from Congo Female Poverty Among 25-34 Year Olds Correlation Chart

The statistical analysis conducted on geographies consisting of 221,750,930 people shows no correlation between the proportion of Ethiopians and poverty level among females between the ages 25 and 34 in the United States with a correlation coefficient (R) of -0.008 and weighted average of 12.4%. Similarly, the statistical analysis conducted on geographies consisting of 91,915,902 people shows a slight positive correlation between the proportion of Immigrants from Congo and poverty level among females between the ages 25 and 34 in the United States with a correlation coefficient (R) of 0.084 and weighted average of 16.7%, a difference of 34.7%.
Ethiopian vs Immigrants from Congo Female Poverty Among 25-34 Year Olds

Female Poverty Among 25-34 Year Olds Correlation Summary

MeasurementEthiopianImmigrants from Congo
Minimum4.0%4.4%
Maximum23.7%41.2%
Range19.7%36.8%
Mean11.8%18.5%
Median11.9%16.8%
Interquartile 25% (IQ1)9.7%14.5%
Interquartile 75% (IQ3)13.4%20.1%
Interquartile Range (IQR)3.7%5.7%
Standard Deviation (Sample)3.7%7.8%
Standard Deviation (Population)3.7%7.7%

Similar Demographics by Female Poverty Among 25-34 Year Olds

Demographics Similar to Ethiopians by Female Poverty Among 25-34 Year Olds

In terms of female poverty among 25-34 year olds, the demographic groups most similar to Ethiopians are Immigrants from Kazakhstan (12.4%, a difference of 0.080%), Immigrants from Malaysia (12.4%, a difference of 0.32%), Albanian (12.5%, a difference of 0.32%), Immigrants from Latvia (12.5%, a difference of 0.38%), and Immigrants from South Eastern Asia (12.5%, a difference of 0.49%).
DemographicsRating | RankFemale Poverty Among 25-34 Year Olds
Estonians
98.9
/100
|
#75
Exceptional
12.3%
Greeks
98.9
/100
|
#76
Exceptional
12.3%
Immigrants | Italy
98.8
/100
|
#77
Exceptional
12.3%
Immigrants | Ukraine
98.6
/100
|
#78
Exceptional
12.3%
Immigrants | Jordan
98.5
/100
|
#79
Exceptional
12.4%
Immigrants | Malaysia
98.3
/100
|
#80
Exceptional
12.4%
Immigrants | Kazakhstan
98.1
/100
|
#81
Exceptional
12.4%
Ethiopians
98.0
/100
|
#82
Exceptional
12.4%
Albanians
97.7
/100
|
#83
Exceptional
12.5%
Immigrants | Latvia
97.7
/100
|
#84
Exceptional
12.5%
Immigrants | South Eastern Asia
97.6
/100
|
#85
Exceptional
12.5%
Croatians
97.5
/100
|
#86
Exceptional
12.5%
Argentineans
97.5
/100
|
#87
Exceptional
12.5%
Immigrants | Austria
97.4
/100
|
#88
Exceptional
12.5%
Italians
97.2
/100
|
#89
Exceptional
12.5%

Demographics Similar to Immigrants from Congo by Female Poverty Among 25-34 Year Olds

In terms of female poverty among 25-34 year olds, the demographic groups most similar to Immigrants from Congo are U.S. Virgin Islander (16.7%, a difference of 0.010%), Alaska Native (16.8%, a difference of 0.11%), Spanish American (16.7%, a difference of 0.16%), Blackfeet (16.7%, a difference of 0.20%), and Immigrants from Mexico (16.8%, a difference of 0.43%).
DemographicsRating | RankFemale Poverty Among 25-34 Year Olds
Immigrants | Central America
0.0
/100
|
#294
Tragic
16.6%
Mexicans
0.0
/100
|
#295
Tragic
16.6%
Hispanics or Latinos
0.0
/100
|
#296
Tragic
16.6%
Immigrants | Guatemala
0.0
/100
|
#297
Tragic
16.6%
Blackfeet
0.0
/100
|
#298
Tragic
16.7%
Spanish Americans
0.0
/100
|
#299
Tragic
16.7%
U.S. Virgin Islanders
0.0
/100
|
#300
Tragic
16.7%
Immigrants | Congo
0.0
/100
|
#301
Tragic
16.7%
Alaska Natives
0.0
/100
|
#302
Tragic
16.8%
Immigrants | Mexico
0.0
/100
|
#303
Tragic
16.8%
Hondurans
0.0
/100
|
#304
Tragic
16.9%
Immigrants | Cabo Verde
0.0
/100
|
#305
Tragic
16.9%
Chickasaw
0.0
/100
|
#306
Tragic
17.0%
Yaqui
0.0
/100
|
#307
Tragic
17.0%
Africans
0.0
/100
|
#308
Tragic
17.0%