Estonian vs Cuban Single Father Poverty
COMPARE
Estonian
Cuban
Single Father Poverty
Single Father Poverty Comparison
Estonians
Cubans
16.2%
SINGLE FATHER POVERTY
56.7/ 100
METRIC RATING
161st/ 347
METRIC RANK
16.6%
SINGLE FATHER POVERTY
16.5/ 100
METRIC RATING
201st/ 347
METRIC RANK
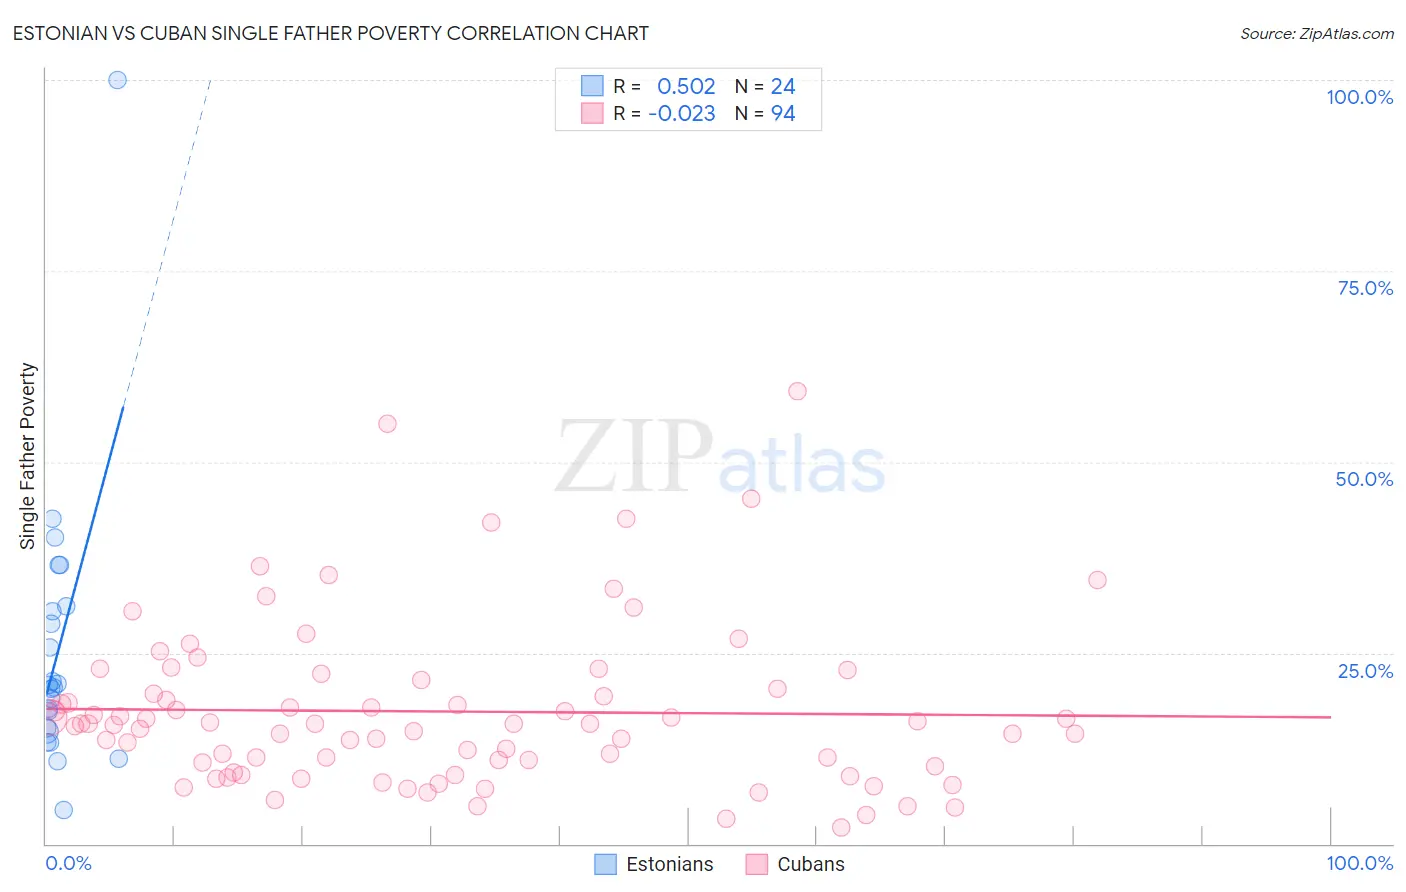
Estonian vs Cuban Single Father Poverty Correlation Chart
The statistical analysis conducted on geographies consisting of 107,284,896 people shows a substantial positive correlation between the proportion of Estonians and poverty level among single fathers in the United States with a correlation coefficient (R) of 0.502 and weighted average of 16.2%. Similarly, the statistical analysis conducted on geographies consisting of 350,103,033 people shows no correlation between the proportion of Cubans and poverty level among single fathers in the United States with a correlation coefficient (R) of -0.023 and weighted average of 16.6%, a difference of 2.1%.
Single Father Poverty Correlation Summary
| Measurement | Estonian | Cuban |
| Minimum | 4.3% | 2.1% |
| Maximum | 100.0% | 59.3% |
| Range | 95.7% | 57.2% |
| Mean | 25.5% | 17.3% |
| Median | 20.6% | 15.6% |
| Interquartile 25% (IQ1) | 14.9% | 10.1% |
| Interquartile 75% (IQ3) | 30.7% | 20.3% |
| Interquartile Range (IQR) | 15.8% | 10.2% |
| Standard Deviation (Sample) | 18.7% | 10.7% |
| Standard Deviation (Population) | 18.3% | 10.7% |
Similar Demographics by Single Father Poverty
Demographics Similar to Estonians by Single Father Poverty
In terms of single father poverty, the demographic groups most similar to Estonians are Ugandan (16.3%, a difference of 0.040%), Immigrants from Costa Rica (16.3%, a difference of 0.040%), Guyanese (16.3%, a difference of 0.070%), Immigrants from Bangladesh (16.3%, a difference of 0.070%), and Immigrants from Europe (16.3%, a difference of 0.080%).
| Demographics | Rating | Rank | Single Father Poverty |
| Mexicans | 70.1 /100 | #154 | Good 16.1% |
| Immigrants | Nicaragua | 67.8 /100 | #155 | Good 16.2% |
| Immigrants | Jordan | 66.0 /100 | #156 | Good 16.2% |
| Immigrants | Czechoslovakia | 62.8 /100 | #157 | Good 16.2% |
| Portuguese | 62.3 /100 | #158 | Good 16.2% |
| Belizeans | 59.9 /100 | #159 | Average 16.2% |
| Immigrants | Sudan | 59.8 /100 | #160 | Average 16.2% |
| Estonians | 56.7 /100 | #161 | Average 16.2% |
| Ugandans | 55.9 /100 | #162 | Average 16.3% |
| Immigrants | Costa Rica | 55.7 /100 | #163 | Average 16.3% |
| Guyanese | 55.2 /100 | #164 | Average 16.3% |
| Immigrants | Bangladesh | 55.1 /100 | #165 | Average 16.3% |
| Immigrants | Europe | 54.8 /100 | #166 | Average 16.3% |
| Yugoslavians | 53.9 /100 | #167 | Average 16.3% |
| Costa Ricans | 53.6 /100 | #168 | Average 16.3% |
Demographics Similar to Cubans by Single Father Poverty
In terms of single father poverty, the demographic groups most similar to Cubans are Immigrants from Croatia (16.6%, a difference of 0.0%), Syrian (16.6%, a difference of 0.070%), Immigrants from North America (16.6%, a difference of 0.12%), Immigrants from Guatemala (16.6%, a difference of 0.15%), and Venezuelan (16.6%, a difference of 0.19%).
| Demographics | Rating | Rank | Single Father Poverty |
| Cape Verdeans | 24.4 /100 | #194 | Fair 16.5% |
| Immigrants | Barbados | 24.3 /100 | #195 | Fair 16.5% |
| Immigrants | Canada | 21.9 /100 | #196 | Fair 16.5% |
| Immigrants | Northern Europe | 20.3 /100 | #197 | Fair 16.5% |
| Romanians | 20.1 /100 | #198 | Fair 16.5% |
| Immigrants | Belize | 19.8 /100 | #199 | Poor 16.5% |
| Syrians | 17.4 /100 | #200 | Poor 16.6% |
| Cubans | 16.5 /100 | #201 | Poor 16.6% |
| Immigrants | Croatia | 16.5 /100 | #202 | Poor 16.6% |
| Immigrants | North America | 15.1 /100 | #203 | Poor 16.6% |
| Immigrants | Guatemala | 14.8 /100 | #204 | Poor 16.6% |
| Venezuelans | 14.3 /100 | #205 | Poor 16.6% |
| Immigrants | Senegal | 13.7 /100 | #206 | Poor 16.6% |
| New Zealanders | 13.7 /100 | #207 | Poor 16.6% |
| Eastern Europeans | 13.7 /100 | #208 | Poor 16.6% |