English vs Immigrants from Lithuania Female Poverty Among 18-24 Year Olds
COMPARE
English
Immigrants from Lithuania
Female Poverty Among 18-24 Year Olds
Female Poverty Among 18-24 Year Olds Comparison
English
Immigrants from Lithuania
20.5%
FEMALE POVERTY AMONG 18-24 YEAR OLDS
16.7/ 100
METRIC RATING
205th/ 347
METRIC RANK
17.4%
FEMALE POVERTY AMONG 18-24 YEAR OLDS
100.0/ 100
METRIC RATING
19th/ 347
METRIC RANK
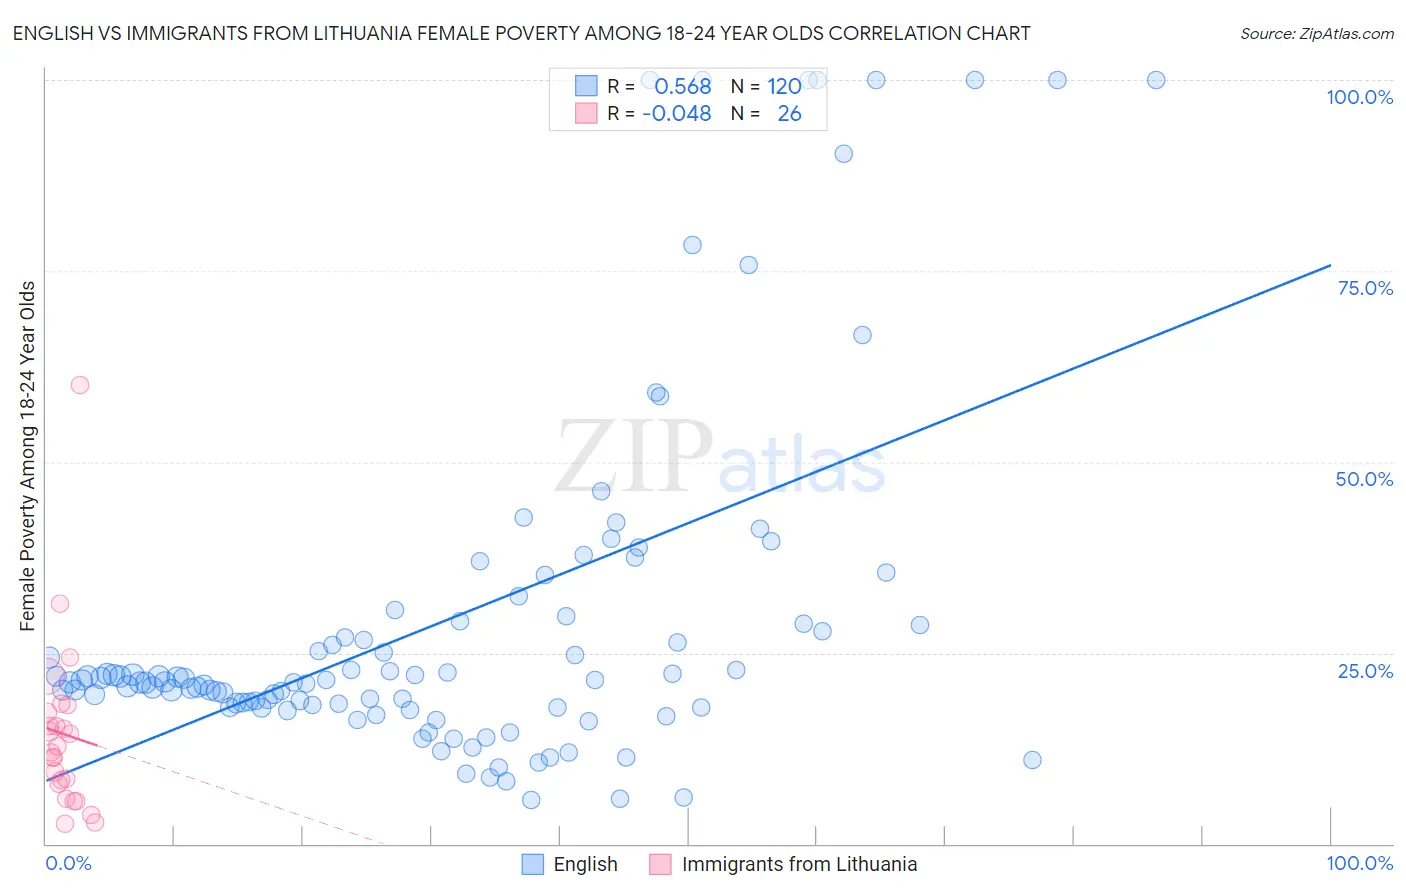
English vs Immigrants from Lithuania Female Poverty Among 18-24 Year Olds Correlation Chart
The statistical analysis conducted on geographies consisting of 541,696,358 people shows a substantial positive correlation between the proportion of English and poverty level among females between the ages 18 and 24 in the United States with a correlation coefficient (R) of 0.568 and weighted average of 20.5%. Similarly, the statistical analysis conducted on geographies consisting of 116,192,815 people shows no correlation between the proportion of Immigrants from Lithuania and poverty level among females between the ages 18 and 24 in the United States with a correlation coefficient (R) of -0.048 and weighted average of 17.4%, a difference of 17.7%.
Female Poverty Among 18-24 Year Olds Correlation Summary
| Measurement | English | Immigrants from Lithuania |
| Minimum | 5.7% | 2.6% |
| Maximum | 100.0% | 60.0% |
| Range | 94.3% | 57.4% |
| Mean | 29.3% | 14.4% |
| Median | 21.3% | 12.3% |
| Interquartile 25% (IQ1) | 18.0% | 7.8% |
| Interquartile 75% (IQ3) | 28.9% | 17.2% |
| Interquartile Range (IQR) | 10.9% | 9.3% |
| Standard Deviation (Sample) | 23.4% | 11.6% |
| Standard Deviation (Population) | 23.3% | 11.3% |
Similar Demographics by Female Poverty Among 18-24 Year Olds
Demographics Similar to English by Female Poverty Among 18-24 Year Olds
In terms of female poverty among 18-24 year olds, the demographic groups most similar to English are Hispanic or Latino (20.5%, a difference of 0.010%), Immigrants from Netherlands (20.5%, a difference of 0.020%), Spaniard (20.5%, a difference of 0.030%), Immigrants from Malaysia (20.5%, a difference of 0.040%), and Dutch (20.5%, a difference of 0.070%).
| Demographics | Rating | Rank | Female Poverty Among 18-24 Year Olds |
| Immigrants | Spain | 20.7 /100 | #198 | Fair 20.4% |
| Germans | 20.6 /100 | #199 | Fair 20.4% |
| Europeans | 19.9 /100 | #200 | Poor 20.4% |
| Mexicans | 18.3 /100 | #201 | Poor 20.5% |
| Immigrants | Turkey | 17.7 /100 | #202 | Poor 20.5% |
| Immigrants | Malaysia | 17.2 /100 | #203 | Poor 20.5% |
| Immigrants | Netherlands | 17.0 /100 | #204 | Poor 20.5% |
| English | 16.7 /100 | #205 | Poor 20.5% |
| Hispanics or Latinos | 16.6 /100 | #206 | Poor 20.5% |
| Spaniards | 16.3 /100 | #207 | Poor 20.5% |
| Dutch | 15.9 /100 | #208 | Poor 20.5% |
| Arabs | 15.5 /100 | #209 | Poor 20.5% |
| Immigrants | Ghana | 14.3 /100 | #210 | Poor 20.5% |
| Immigrants | Western Europe | 13.5 /100 | #211 | Poor 20.6% |
| Liberians | 11.6 /100 | #212 | Poor 20.6% |
Demographics Similar to Immigrants from Lithuania by Female Poverty Among 18-24 Year Olds
In terms of female poverty among 18-24 year olds, the demographic groups most similar to Immigrants from Lithuania are Immigrants from Venezuela (17.4%, a difference of 0.13%), Bolivian (17.4%, a difference of 0.13%), Immigrants from Hong Kong (17.5%, a difference of 0.23%), Immigrants from Colombia (17.3%, a difference of 0.41%), and Immigrants from North Macedonia (17.6%, a difference of 0.80%).
| Demographics | Rating | Rank | Female Poverty Among 18-24 Year Olds |
| Immigrants | Pakistan | 100.0 /100 | #12 | Exceptional 17.0% |
| Immigrants | Poland | 100.0 /100 | #13 | Exceptional 17.1% |
| Tongans | 100.0 /100 | #14 | Exceptional 17.1% |
| Cubans | 100.0 /100 | #15 | Exceptional 17.2% |
| Peruvians | 100.0 /100 | #16 | Exceptional 17.2% |
| Immigrants | Taiwan | 100.0 /100 | #17 | Exceptional 17.3% |
| Immigrants | Colombia | 100.0 /100 | #18 | Exceptional 17.3% |
| Immigrants | Lithuania | 100.0 /100 | #19 | Exceptional 17.4% |
| Immigrants | Venezuela | 100.0 /100 | #20 | Exceptional 17.4% |
| Bolivians | 100.0 /100 | #21 | Exceptional 17.4% |
| Immigrants | Hong Kong | 100.0 /100 | #22 | Exceptional 17.5% |
| Immigrants | North Macedonia | 100.0 /100 | #23 | Exceptional 17.6% |
| Maltese | 100.0 /100 | #24 | Exceptional 17.6% |
| Immigrants | South Central Asia | 100.0 /100 | #25 | Exceptional 17.6% |
| Immigrants | Fiji | 100.0 /100 | #26 | Exceptional 17.7% |