Egyptian vs Tongan Child Poverty Among Boys Under 16
COMPARE
Egyptian
Tongan
Child Poverty Among Boys Under 16
Child Poverty Among Boys Under 16 Comparison
Egyptians
Tongans
14.7%
CHILD POVERTY AMONG BOYS UNDER 16
97.8/ 100
METRIC RATING
78th/ 347
METRIC RANK
13.4%
CHILD POVERTY AMONG BOYS UNDER 16
99.9/ 100
METRIC RATING
22nd/ 347
METRIC RANK
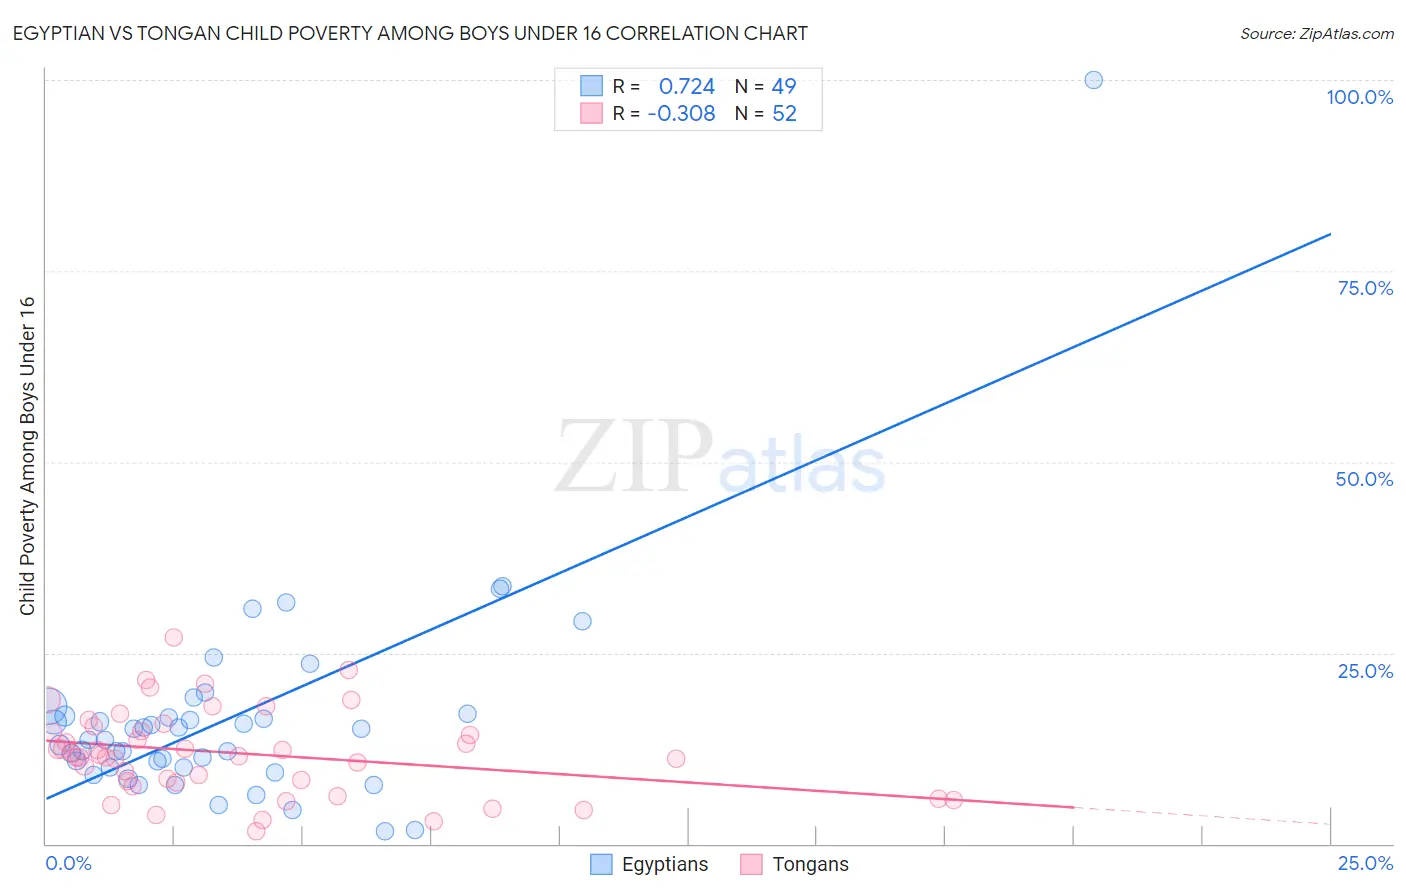
Egyptian vs Tongan Child Poverty Among Boys Under 16 Correlation Chart
The statistical analysis conducted on geographies consisting of 273,791,496 people shows a strong positive correlation between the proportion of Egyptians and poverty level among boys under the age of 16 in the United States with a correlation coefficient (R) of 0.724 and weighted average of 14.7%. Similarly, the statistical analysis conducted on geographies consisting of 102,543,831 people shows a mild negative correlation between the proportion of Tongans and poverty level among boys under the age of 16 in the United States with a correlation coefficient (R) of -0.308 and weighted average of 13.4%, a difference of 9.9%.
Child Poverty Among Boys Under 16 Correlation Summary
| Measurement | Egyptian | Tongan |
| Minimum | 1.6% | 1.7% |
| Maximum | 100.0% | 27.0% |
| Range | 98.4% | 25.3% |
| Mean | 16.4% | 11.9% |
| Median | 13.5% | 11.5% |
| Interquartile 25% (IQ1) | 10.0% | 8.1% |
| Interquartile 75% (IQ3) | 16.9% | 15.1% |
| Interquartile Range (IQR) | 6.9% | 7.0% |
| Standard Deviation (Sample) | 14.3% | 5.6% |
| Standard Deviation (Population) | 14.2% | 5.5% |
Similar Demographics by Child Poverty Among Boys Under 16
Demographics Similar to Egyptians by Child Poverty Among Boys Under 16
In terms of child poverty among boys under 16, the demographic groups most similar to Egyptians are Macedonian (14.7%, a difference of 0.050%), Immigrants from Croatia (14.7%, a difference of 0.11%), Immigrants from Eastern Europe (14.7%, a difference of 0.11%), Immigrants from Poland (14.7%, a difference of 0.16%), and Immigrants from Russia (14.7%, a difference of 0.20%).
| Demographics | Rating | Rank | Child Poverty Among Boys Under 16 |
| Immigrants | Netherlands | 98.1 /100 | #71 | Exceptional 14.6% |
| Immigrants | Latvia | 98.1 /100 | #72 | Exceptional 14.6% |
| Immigrants | Turkey | 98.0 /100 | #73 | Exceptional 14.6% |
| Australians | 98.0 /100 | #74 | Exceptional 14.7% |
| Immigrants | Poland | 97.9 /100 | #75 | Exceptional 14.7% |
| Immigrants | Croatia | 97.9 /100 | #76 | Exceptional 14.7% |
| Macedonians | 97.9 /100 | #77 | Exceptional 14.7% |
| Egyptians | 97.8 /100 | #78 | Exceptional 14.7% |
| Immigrants | Eastern Europe | 97.8 /100 | #79 | Exceptional 14.7% |
| Immigrants | Russia | 97.7 /100 | #80 | Exceptional 14.7% |
| Immigrants | Canada | 97.6 /100 | #81 | Exceptional 14.7% |
| Ukrainians | 97.6 /100 | #82 | Exceptional 14.7% |
| Immigrants | South Africa | 97.4 /100 | #83 | Exceptional 14.8% |
| Swiss | 97.3 /100 | #84 | Exceptional 14.8% |
| Taiwanese | 97.3 /100 | #85 | Exceptional 14.8% |
Demographics Similar to Tongans by Child Poverty Among Boys Under 16
In terms of child poverty among boys under 16, the demographic groups most similar to Tongans are Immigrants from Eastern Asia (13.3%, a difference of 0.080%), Latvian (13.4%, a difference of 0.080%), Indian (Asian) (13.3%, a difference of 0.68%), Bolivian (13.3%, a difference of 0.72%), and Bulgarian (13.3%, a difference of 0.78%).
| Demographics | Rating | Rank | Child Poverty Among Boys Under 16 |
| Immigrants | Japan | 99.9 /100 | #15 | Exceptional 13.1% |
| Maltese | 99.9 /100 | #16 | Exceptional 13.2% |
| Norwegians | 99.9 /100 | #17 | Exceptional 13.2% |
| Bulgarians | 99.9 /100 | #18 | Exceptional 13.3% |
| Bolivians | 99.9 /100 | #19 | Exceptional 13.3% |
| Indians (Asian) | 99.9 /100 | #20 | Exceptional 13.3% |
| Immigrants | Eastern Asia | 99.9 /100 | #21 | Exceptional 13.3% |
| Tongans | 99.9 /100 | #22 | Exceptional 13.4% |
| Latvians | 99.9 /100 | #23 | Exceptional 13.4% |
| Immigrants | Lithuania | 99.8 /100 | #24 | Exceptional 13.5% |
| Okinawans | 99.8 /100 | #25 | Exceptional 13.5% |
| Immigrants | Bolivia | 99.8 /100 | #26 | Exceptional 13.5% |
| Asians | 99.8 /100 | #27 | Exceptional 13.5% |
| Eastern Europeans | 99.8 /100 | #28 | Exceptional 13.5% |
| Cypriots | 99.8 /100 | #29 | Exceptional 13.6% |