Egyptian vs Immigrants from India Seniors Poverty Over the Age of 75
COMPARE
Egyptian
Immigrants from India
Seniors Poverty Over the Age of 75
Seniors Poverty Over the Age of 75 Comparison
Egyptians
Immigrants from India
12.1%
SENIORS POVERTY OVER THE AGE OF 75
54.8/ 100
METRIC RATING
166th/ 347
METRIC RANK
10.4%
SENIORS POVERTY OVER THE AGE OF 75
99.9/ 100
METRIC RATING
11th/ 347
METRIC RANK
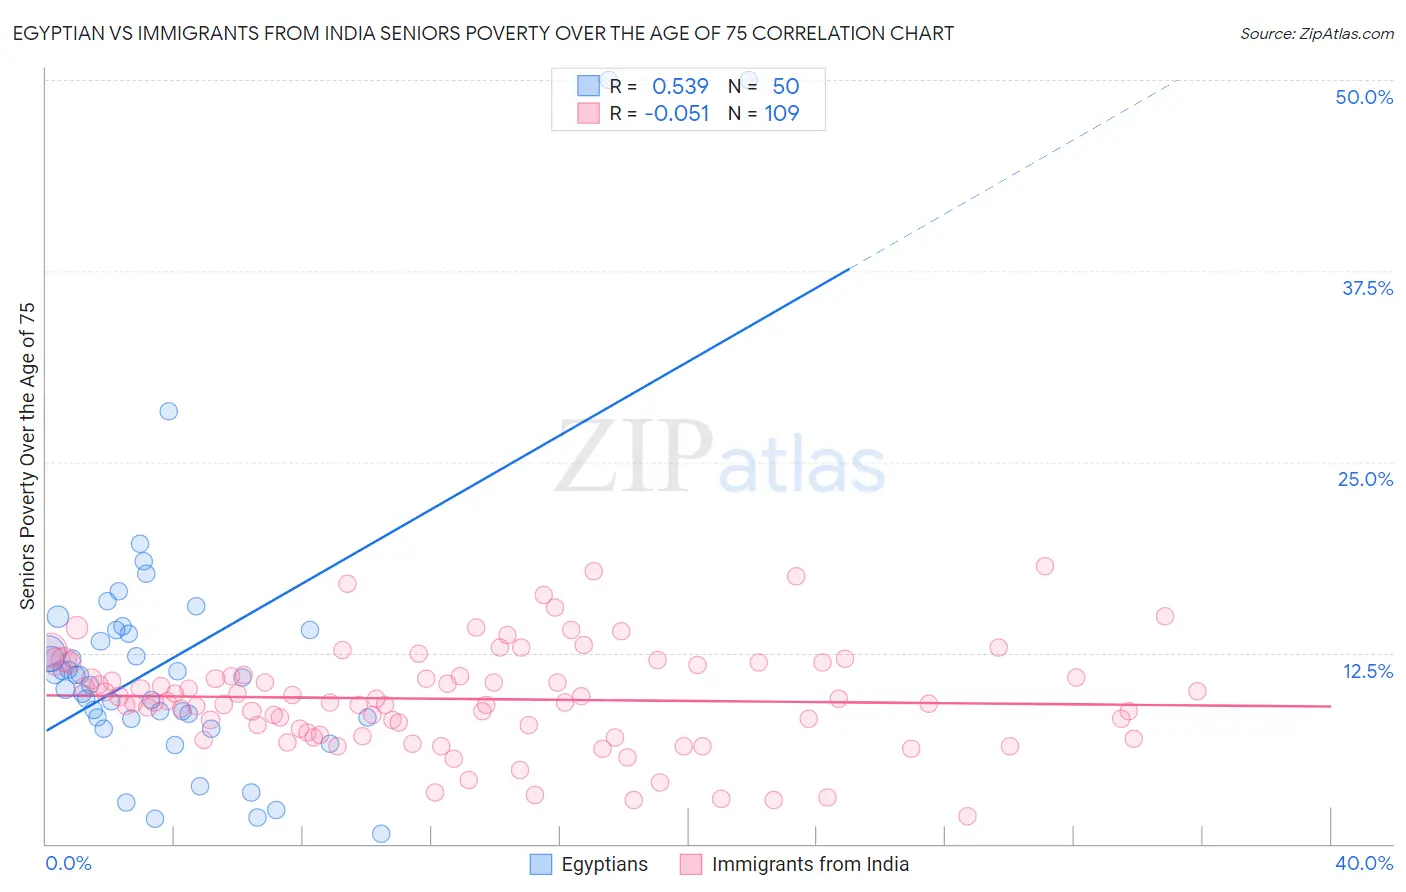
Egyptian vs Immigrants from India Seniors Poverty Over the Age of 75 Correlation Chart
The statistical analysis conducted on geographies consisting of 274,710,224 people shows a substantial positive correlation between the proportion of Egyptians and poverty level among seniors over the age of 75 in the United States with a correlation coefficient (R) of 0.539 and weighted average of 12.1%. Similarly, the statistical analysis conducted on geographies consisting of 428,032,626 people shows a slight negative correlation between the proportion of Immigrants from India and poverty level among seniors over the age of 75 in the United States with a correlation coefficient (R) of -0.051 and weighted average of 10.4%, a difference of 16.2%.
Seniors Poverty Over the Age of 75 Correlation Summary
| Measurement | Egyptian | Immigrants from India |
| Minimum | 0.66% | 1.8% |
| Maximum | 50.0% | 18.2% |
| Range | 49.3% | 16.4% |
| Mean | 12.1% | 9.5% |
| Median | 11.0% | 9.3% |
| Interquartile 25% (IQ1) | 8.3% | 7.2% |
| Interquartile 75% (IQ3) | 14.0% | 11.3% |
| Interquartile Range (IQR) | 5.7% | 4.1% |
| Standard Deviation (Sample) | 9.3% | 3.3% |
| Standard Deviation (Population) | 9.2% | 3.3% |
Similar Demographics by Seniors Poverty Over the Age of 75
Demographics Similar to Egyptians by Seniors Poverty Over the Age of 75
In terms of seniors poverty over the age of 75, the demographic groups most similar to Egyptians are Immigrants from Switzerland (12.1%, a difference of 0.020%), Immigrants from Syria (12.2%, a difference of 0.080%), Immigrants from Egypt (12.2%, a difference of 0.090%), Okinawan (12.1%, a difference of 0.12%), and Potawatomi (12.1%, a difference of 0.21%).
| Demographics | Rating | Rank | Seniors Poverty Over the Age of 75 |
| Immigrants | Middle Africa | 61.2 /100 | #159 | Good 12.1% |
| Immigrants | Eastern Africa | 60.9 /100 | #160 | Good 12.1% |
| Immigrants | Norway | 60.6 /100 | #161 | Good 12.1% |
| Immigrants | Serbia | 60.2 /100 | #162 | Good 12.1% |
| Immigrants | Greece | 58.2 /100 | #163 | Average 12.1% |
| Potawatomi | 57.4 /100 | #164 | Average 12.1% |
| Okinawans | 56.3 /100 | #165 | Average 12.1% |
| Egyptians | 54.8 /100 | #166 | Average 12.1% |
| Immigrants | Switzerland | 54.5 /100 | #167 | Average 12.1% |
| Immigrants | Syria | 53.9 /100 | #168 | Average 12.2% |
| Immigrants | Egypt | 53.7 /100 | #169 | Average 12.2% |
| Immigrants | Thailand | 52.0 /100 | #170 | Average 12.2% |
| Spaniards | 51.6 /100 | #171 | Average 12.2% |
| Immigrants | Fiji | 51.5 /100 | #172 | Average 12.2% |
| Arabs | 50.5 /100 | #173 | Average 12.2% |
Demographics Similar to Immigrants from India by Seniors Poverty Over the Age of 75
In terms of seniors poverty over the age of 75, the demographic groups most similar to Immigrants from India are Scandinavian (10.4%, a difference of 0.070%), Tongan (10.5%, a difference of 0.36%), Croatian (10.5%, a difference of 0.46%), English (10.4%, a difference of 0.56%), and Scottish (10.5%, a difference of 0.61%).
| Demographics | Rating | Rank | Seniors Poverty Over the Age of 75 |
| Swedes | 100.0 /100 | #4 | Exceptional 10.2% |
| Norwegians | 100.0 /100 | #5 | Exceptional 10.2% |
| Danes | 100.0 /100 | #6 | Exceptional 10.2% |
| Maltese | 100.0 /100 | #7 | Exceptional 10.3% |
| Germans | 99.9 /100 | #8 | Exceptional 10.4% |
| English | 99.9 /100 | #9 | Exceptional 10.4% |
| Scandinavians | 99.9 /100 | #10 | Exceptional 10.4% |
| Immigrants | India | 99.9 /100 | #11 | Exceptional 10.4% |
| Tongans | 99.9 /100 | #12 | Exceptional 10.5% |
| Croatians | 99.9 /100 | #13 | Exceptional 10.5% |
| Scottish | 99.9 /100 | #14 | Exceptional 10.5% |
| Europeans | 99.9 /100 | #15 | Exceptional 10.5% |
| Dutch | 99.9 /100 | #16 | Exceptional 10.5% |
| Slovaks | 99.9 /100 | #17 | Exceptional 10.5% |
| Welsh | 99.9 /100 | #18 | Exceptional 10.5% |