Egyptian vs Immigrants from Denmark Child Poverty Under the Age of 16

COMPARE

Egyptian
Race
Ancestry
AfghanAfricanAlaska NativeAlaskan AthabascanAlbanianAleutAlsatianAmericanApacheArabArapahoArgentineanArmenianAssyrian/Chaldean/SyriacAustralianAustrianBahamianBangladeshiBarbadianBasqueBelgianBelizeanBermudanBhutaneseBlackfeetBolivianBrazilianBritishBritish West IndianBulgarianBurmeseCajunCambodianCanadianCape VerdeanCarpatho RusynCelticCentral AmericanCentral American IndianCherokeeCheyenneChickasawChileanChineseChippewaChoctawColombianColvilleComancheCosta RicanCreeCreekCroatianCrowCubanCypriotCzechCzechoslovakianDanishDelawareDominicanDutchDutch West IndianEastern EuropeanEcuadorianEgyptianEnglishEstonianEthiopianEuropeanFijianFilipinoFinnishFrenchFrench American IndianFrench CanadianGermanGerman RussianGhanaianGreekGuamanian/ChamorroGuatemalanGuyaneseHaitianHmongHonduranHopiHoumaHungarianIcelanderIndian (Asian)IndonesianInupiatIranianIraqiIrishIroquoisIsraeliItalianJamaicanJapaneseJordanianKenyanKiowaKoreanLaotianLatvianLebaneseLiberianLithuanianLumbeeLuxembourgerMacedonianMalaysianMalteseMarshalleseMenomineeMexicanMexican American IndianMongolianMoroccanNative HawaiianNavajoNepaleseNew ZealanderNicaraguanNigerianNorthern EuropeanNorwegianOkinawanOsageOttawaPaiutePakistaniPalestinianPanamanianParaguayanPennsylvania GermanPeruvianPimaPolishPortuguesePotawatomiPuebloPuerto RicanPuget Sound SalishRomanianRussianSalvadoranSamoanScandinavianScotch-IrishScottishSeminoleSenegaleseSerbianShoshoneSierra LeoneanSiouxSlavicSlovakSloveneSomaliSouth AfricanSouth AmericanSouth American IndianSoviet UnionSpaniardSpanishSpanish AmericanSpanish American IndianSri LankanSubsaharan AfricanSudaneseSwedishSwissSyrianTaiwaneseThaiTlingit-HaidaTohono O'OdhamTonganTrinidadian and TobagonianTsimshianTurkishU.S. Virgin IslanderUgandanUkrainianUruguayanUteVenezuelanVietnameseWelshWest IndianYakamaYaquiYugoslavianYumanYup'ikZimbabwean
Immigration
NonimmigrantsImmigrantsAfghanistanAfricaAlbaniaArgentinaArmeniaAsiaAustraliaAustriaBahamasBangladeshBarbadosBelarusBelgiumBelizeBoliviaBosnia and HerzegovinaBrazilBulgariaBurma/MyanmarCabo VerdeCambodiaCameroonCanadaCaribbeanCentral AmericaChileChinaColombiaCongoCosta RicaCroatiaCubaCzechoslovakiaDominicaDominican RepublicEastern AfricaEastern AsiaEastern EuropeEcuadorEgyptEl SalvadorEnglandEritreaEthiopiaEuropeFijiFranceGermanyGhanaGreeceGrenadaGuatemalaGuyanaHaitiHondurasHong KongHungaryIndiaIndonesiaIranIraqIrelandIsraelItalyJamaicaJapanJordanKazakhstanKenyaKoreaKuwaitLaosLatin AmericaLatviaLebanonLiberiaLithuaniaMalaysiaMexicoMicronesiaMiddle AfricaMoldovaMoroccoNepalNetherlandsNicaraguaNigeriaNorth AmericaNorth MacedoniaNorthern AfricaNorthern EuropeNorwayOceaniaPakistanPanamaPeruPhilippinesPolandPortugalRomaniaRussiaSaudi ArabiaScotlandSenegalSerbiaSierra LeoneSingaporeSomaliaSouth AfricaSouth AmericaSouth Central AsiaSouth Eastern AsiaSouthern EuropeSpainSri LankaSt. Vincent and the GrenadinesSudanSwedenSwitzerlandSyriaTaiwanThailandTrinidad and TobagoTurkeyUgandaUkraineUruguayUzbekistanVenezuelaVietnamWest IndiesWestern AfricaWestern AsiaWestern EuropeYemenZaireZimbabweAzores
Immigrants from Denmark
Race
Ancestry
AfghanAfricanAlaska NativeAlaskan AthabascanAlbanianAleutAlsatianAmericanApacheArabArapahoArgentineanArmenianAssyrian/Chaldean/SyriacAustralianAustrianBahamianBangladeshiBarbadianBasqueBelgianBelizeanBermudanBhutaneseBlackfeetBolivianBrazilianBritishBritish West IndianBulgarianBurmeseCajunCambodianCanadianCape VerdeanCarpatho RusynCelticCentral AmericanCentral American IndianCherokeeCheyenneChickasawChileanChineseChippewaChoctawColombianColvilleComancheCosta RicanCreeCreekCroatianCrowCubanCypriotCzechCzechoslovakianDanishDelawareDominicanDutchDutch West IndianEastern EuropeanEcuadorianEnglishEstonianEthiopianEuropeanFijianFilipinoFinnishFrenchFrench American IndianFrench CanadianGermanGerman RussianGhanaianGreekGuamanian/ChamorroGuatemalanGuyaneseHaitianHmongHonduranHopiHoumaHungarianIcelanderIndian (Asian)IndonesianInupiatIranianIraqiIrishIroquoisIsraeliItalianJamaicanJapaneseJordanianKenyanKiowaKoreanLaotianLatvianLebaneseLiberianLithuanianLumbeeLuxembourgerMacedonianMalaysianMalteseMarshalleseMenomineeMexicanMexican American IndianMongolianMoroccanNative HawaiianNavajoNepaleseNew ZealanderNicaraguanNigerianNorthern EuropeanNorwegianOkinawanOsageOttawaPaiutePakistaniPalestinianPanamanianParaguayanPennsylvania GermanPeruvianPimaPolishPortuguesePotawatomiPuebloPuerto RicanPuget Sound SalishRomanianRussianSalvadoranSamoanScandinavianScotch-IrishScottishSeminoleSenegaleseSerbianShoshoneSierra LeoneanSiouxSlavicSlovakSloveneSomaliSouth AfricanSouth AmericanSouth American IndianSoviet UnionSpaniardSpanishSpanish AmericanSpanish American IndianSri LankanSubsaharan AfricanSudaneseSwedishSwissSyrianTaiwaneseThaiTlingit-HaidaTohono O'OdhamTonganTrinidadian and TobagonianTsimshianTurkishU.S. Virgin IslanderUgandanUkrainianUruguayanUteVenezuelanVietnameseWelshWest IndianYakamaYaquiYugoslavianYumanYup'ikZimbabwean
Immigration
NonimmigrantsImmigrantsAfghanistanAfricaAlbaniaArgentinaArmeniaAsiaAustraliaAustriaBahamasBangladeshBarbadosBelarusBelgiumBelizeBoliviaBosnia and HerzegovinaBrazilBulgariaBurma/MyanmarCabo VerdeCambodiaCameroonCanadaCaribbeanCentral AmericaChileChinaColombiaCongoCosta RicaCroatiaCubaCzechoslovakiaDenmarkDominicaDominican RepublicEastern AfricaEastern AsiaEastern EuropeEcuadorEgyptEl SalvadorEnglandEritreaEthiopiaEuropeFijiFranceGermanyGhanaGreeceGrenadaGuatemalaGuyanaHaitiHondurasHong KongHungaryIndiaIndonesiaIranIraqIrelandIsraelItalyJamaicaJapanJordanKazakhstanKenyaKoreaKuwaitLaosLatin AmericaLatviaLebanonLiberiaLithuaniaMalaysiaMexicoMicronesiaMiddle AfricaMoldovaMoroccoNepalNetherlandsNicaraguaNigeriaNorth AmericaNorth MacedoniaNorthern AfricaNorthern EuropeNorwayOceaniaPakistanPanamaPeruPhilippinesPolandPortugalRomaniaRussiaSaudi ArabiaScotlandSenegalSerbiaSierra LeoneSingaporeSomaliaSouth AfricaSouth AmericaSouth Central AsiaSouth Eastern AsiaSouthern EuropeSpainSri LankaSt. Vincent and the GrenadinesSudanSwedenSwitzerlandSyriaTaiwanThailandTrinidad and TobagoTurkeyUgandaUkraineUruguayUzbekistanVenezuelaVietnamWest IndiesWestern AfricaWestern AsiaWestern EuropeYemenZaireZimbabweAzores
Child Poverty Under the Age of 16
Income
Poverty
Unemployment
Labor Participation
Family Structure
Vehicle Availability
Education Level
Disability

Child Poverty Under the Age of 16 Comparison

Egyptians

Immigrants from Denmark

Exceptional
Exceptional
14.5%
CHILD POVERTY UNDER THE AGE OF 16
97.2/ 100
METRIC RATING
83rd/ 347
METRIC RANK
14.9%
CHILD POVERTY UNDER THE AGE OF 16
93.5/ 100
METRIC RATING
111th/ 347
METRIC RANK

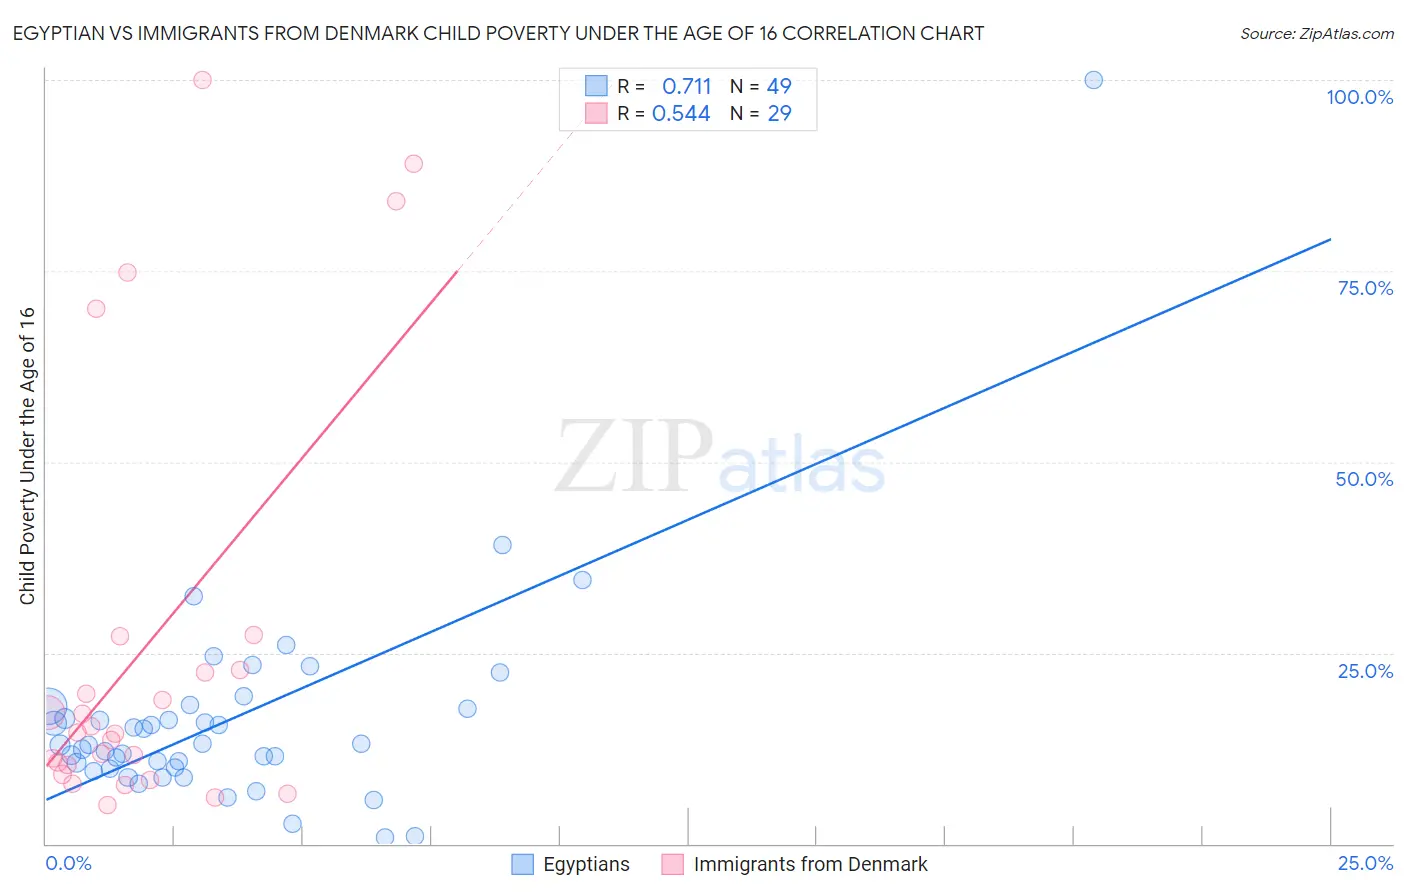
Egyptian vs Immigrants from Denmark Child Poverty Under the Age of 16 Correlation Chart

The statistical analysis conducted on geographies consisting of 275,197,648 people shows a strong positive correlation between the proportion of Egyptians and poverty level among children under the age of 16 in the United States with a correlation coefficient (R) of 0.711 and weighted average of 14.5%. Similarly, the statistical analysis conducted on geographies consisting of 135,715,778 people shows a substantial positive correlation between the proportion of Immigrants from Denmark and poverty level among children under the age of 16 in the United States with a correlation coefficient (R) of 0.544 and weighted average of 14.9%, a difference of 2.9%.
Egyptian vs Immigrants from Denmark Child Poverty Under the Age of 16

Child Poverty Under the Age of 16 Correlation Summary

MeasurementEgyptianImmigrants from Denmark
Minimum0.84%5.1%
Maximum100.0%100.0%
Range99.2%94.9%
Mean16.2%26.0%
Median12.9%14.6%
Interquartile 25% (IQ1)10.0%9.7%
Interquartile 75% (IQ3)17.9%25.0%
Interquartile Range (IQR)7.9%15.3%
Standard Deviation (Sample)14.5%27.7%
Standard Deviation (Population)14.3%27.3%

Similar Demographics by Child Poverty Under the Age of 16

Demographics Similar to Egyptians by Child Poverty Under the Age of 16

In terms of child poverty under the age of 16, the demographic groups most similar to Egyptians are Immigrants from Latvia (14.5%, a difference of 0.020%), Immigrants from Canada (14.5%, a difference of 0.030%), Soviet Union (14.5%, a difference of 0.040%), Finnish (14.5%, a difference of 0.060%), and Immigrants from North Macedonia (14.5%, a difference of 0.090%).
DemographicsRating | RankChild Poverty Under the Age of 16
Immigrants | Eastern Europe
97.5
/100
|
#76
Exceptional
14.4%
Australians
97.5
/100
|
#77
Exceptional
14.4%
Immigrants | Russia
97.3
/100
|
#78
Exceptional
14.5%
Swiss
97.3
/100
|
#79
Exceptional
14.5%
Immigrants | North Macedonia
97.2
/100
|
#80
Exceptional
14.5%
Finns
97.2
/100
|
#81
Exceptional
14.5%
Immigrants | Canada
97.2
/100
|
#82
Exceptional
14.5%
Egyptians
97.2
/100
|
#83
Exceptional
14.5%
Immigrants | Latvia
97.1
/100
|
#84
Exceptional
14.5%
Soviet Union
97.1
/100
|
#85
Exceptional
14.5%
Immigrants | Argentina
97.1
/100
|
#86
Exceptional
14.5%
Taiwanese
97.1
/100
|
#87
Exceptional
14.5%
Northern Europeans
97.0
/100
|
#88
Exceptional
14.5%
Germans
96.9
/100
|
#89
Exceptional
14.5%
Austrians
96.9
/100
|
#90
Exceptional
14.5%

Demographics Similar to Immigrants from Denmark by Child Poverty Under the Age of 16

In terms of child poverty under the age of 16, the demographic groups most similar to Immigrants from Denmark are English (14.9%, a difference of 0.010%), Irish (14.9%, a difference of 0.060%), Belgian (14.9%, a difference of 0.10%), Sri Lankan (14.9%, a difference of 0.13%), and Immigrants from Ukraine (14.9%, a difference of 0.18%).
DemographicsRating | RankChild Poverty Under the Age of 16
Immigrants | England
94.8
/100
|
#104
Exceptional
14.8%
Basques
94.7
/100
|
#105
Exceptional
14.8%
Serbians
94.5
/100
|
#106
Exceptional
14.8%
Chileans
94.4
/100
|
#107
Exceptional
14.8%
Jordanians
94.2
/100
|
#108
Exceptional
14.8%
Tlingit-Haida
94.1
/100
|
#109
Exceptional
14.9%
English
93.5
/100
|
#110
Exceptional
14.9%
Immigrants | Denmark
93.5
/100
|
#111
Exceptional
14.9%
Irish
93.4
/100
|
#112
Exceptional
14.9%
Belgians
93.3
/100
|
#113
Exceptional
14.9%
Sri Lankans
93.2
/100
|
#114
Exceptional
14.9%
Immigrants | Ukraine
93.1
/100
|
#115
Exceptional
14.9%
Carpatho Rusyns
93.1
/100
|
#116
Exceptional
14.9%
Immigrants | Norway
92.8
/100
|
#117
Exceptional
15.0%
Immigrants | Malaysia
92.6
/100
|
#118
Exceptional
15.0%