Ecuadorian vs Immigrants from Ireland Female Poverty Among 25-34 Year Olds
COMPARE
Ecuadorian
Immigrants from Ireland
Female Poverty Among 25-34 Year Olds
Female Poverty Among 25-34 Year Olds Comparison
Ecuadorians
Immigrants from Ireland
14.3%
FEMALE POVERTY AMONG 25-34 YEAR OLDS
5.2/ 100
METRIC RATING
219th/ 347
METRIC RANK
11.2%
FEMALE POVERTY AMONG 25-34 YEAR OLDS
100.0/ 100
METRIC RATING
12th/ 347
METRIC RANK
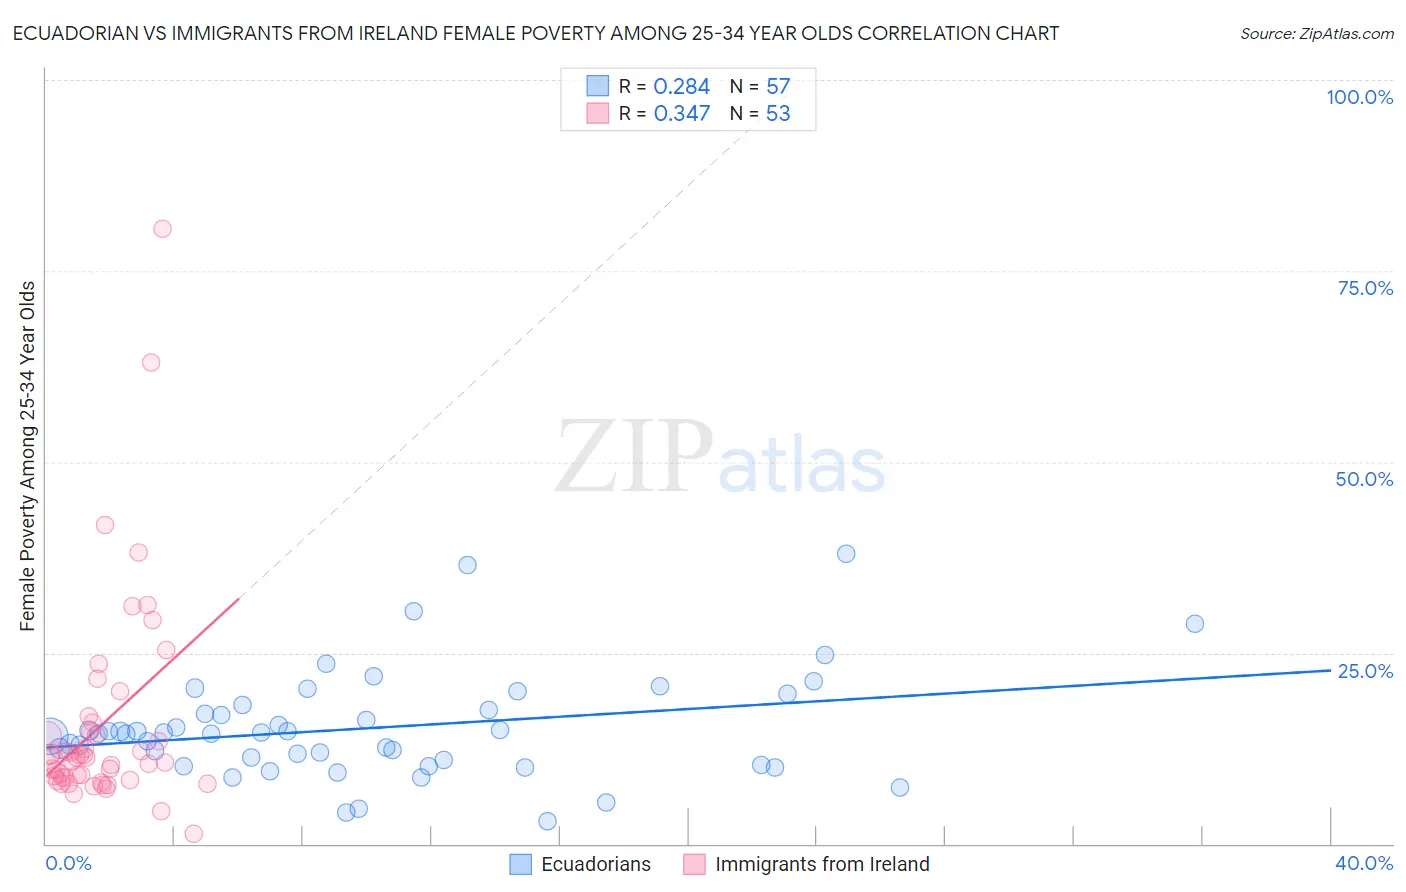
Ecuadorian vs Immigrants from Ireland Female Poverty Among 25-34 Year Olds Correlation Chart
The statistical analysis conducted on geographies consisting of 313,777,043 people shows a weak positive correlation between the proportion of Ecuadorians and poverty level among females between the ages 25 and 34 in the United States with a correlation coefficient (R) of 0.284 and weighted average of 14.3%. Similarly, the statistical analysis conducted on geographies consisting of 237,059,494 people shows a mild positive correlation between the proportion of Immigrants from Ireland and poverty level among females between the ages 25 and 34 in the United States with a correlation coefficient (R) of 0.347 and weighted average of 11.2%, a difference of 28.6%.
Female Poverty Among 25-34 Year Olds Correlation Summary
| Measurement | Ecuadorian | Immigrants from Ireland |
| Minimum | 2.9% | 1.4% |
| Maximum | 38.0% | 80.5% |
| Range | 35.1% | 79.1% |
| Mean | 15.1% | 15.6% |
| Median | 14.5% | 11.3% |
| Interquartile 25% (IQ1) | 10.6% | 8.5% |
| Interquartile 75% (IQ3) | 17.8% | 15.4% |
| Interquartile Range (IQR) | 7.2% | 6.9% |
| Standard Deviation (Sample) | 7.0% | 14.0% |
| Standard Deviation (Population) | 6.9% | 13.9% |
Similar Demographics by Female Poverty Among 25-34 Year Olds
Demographics Similar to Ecuadorians by Female Poverty Among 25-34 Year Olds
In terms of female poverty among 25-34 year olds, the demographic groups most similar to Ecuadorians are Immigrants from Thailand (14.3%, a difference of 0.0%), Spanish American Indian (14.3%, a difference of 0.11%), French Canadian (14.3%, a difference of 0.12%), Ghanaian (14.4%, a difference of 0.16%), and Sudanese (14.4%, a difference of 0.32%).
| Demographics | Rating | Rank | Female Poverty Among 25-34 Year Olds |
| Immigrants | Guyana | 6.6 /100 | #212 | Tragic 14.3% |
| Puget Sound Salish | 6.5 /100 | #213 | Tragic 14.3% |
| French | 6.2 /100 | #214 | Tragic 14.3% |
| Immigrants | Nigeria | 6.2 /100 | #215 | Tragic 14.3% |
| French Canadians | 5.5 /100 | #216 | Tragic 14.3% |
| Spanish American Indians | 5.5 /100 | #217 | Tragic 14.3% |
| Immigrants | Thailand | 5.2 /100 | #218 | Tragic 14.3% |
| Ecuadorians | 5.2 /100 | #219 | Tragic 14.3% |
| Ghanaians | 4.8 /100 | #220 | Tragic 14.4% |
| Sudanese | 4.4 /100 | #221 | Tragic 14.4% |
| Immigrants | Portugal | 4.3 /100 | #222 | Tragic 14.4% |
| Nigerians | 4.2 /100 | #223 | Tragic 14.4% |
| Immigrants | Sudan | 4.0 /100 | #224 | Tragic 14.4% |
| Immigrants | Barbados | 3.4 /100 | #225 | Tragic 14.5% |
| Nicaraguans | 3.3 /100 | #226 | Tragic 14.5% |
Demographics Similar to Immigrants from Ireland by Female Poverty Among 25-34 Year Olds
In terms of female poverty among 25-34 year olds, the demographic groups most similar to Immigrants from Ireland are Burmese (11.2%, a difference of 0.11%), Indian (Asian) (11.2%, a difference of 0.11%), Immigrants from Korea (11.1%, a difference of 0.13%), Assyrian/Chaldean/Syriac (11.2%, a difference of 0.22%), and Immigrants from Bolivia (11.2%, a difference of 0.26%).
| Demographics | Rating | Rank | Female Poverty Among 25-34 Year Olds |
| Immigrants | Hong Kong | 100.0 /100 | #5 | Exceptional 10.4% |
| Immigrants | South Central Asia | 100.0 /100 | #6 | Exceptional 10.8% |
| Chinese | 100.0 /100 | #7 | Exceptional 11.0% |
| Immigrants | Iran | 100.0 /100 | #8 | Exceptional 11.0% |
| Immigrants | Singapore | 100.0 /100 | #9 | Exceptional 11.1% |
| Immigrants | Lithuania | 100.0 /100 | #10 | Exceptional 11.1% |
| Immigrants | Korea | 100.0 /100 | #11 | Exceptional 11.1% |
| Immigrants | Ireland | 100.0 /100 | #12 | Exceptional 11.2% |
| Burmese | 100.0 /100 | #13 | Exceptional 11.2% |
| Indians (Asian) | 100.0 /100 | #14 | Exceptional 11.2% |
| Assyrians/Chaldeans/Syriacs | 100.0 /100 | #15 | Exceptional 11.2% |
| Immigrants | Bolivia | 100.0 /100 | #16 | Exceptional 11.2% |
| Immigrants | China | 100.0 /100 | #17 | Exceptional 11.2% |
| Immigrants | Eastern Asia | 100.0 /100 | #18 | Exceptional 11.2% |
| Iranians | 100.0 /100 | #19 | Exceptional 11.2% |