Eastern European vs Romanian Female Poverty
COMPARE
Eastern European
Romanian
Female Poverty
Female Poverty Comparison
Eastern Europeans
Romanians
11.5%
FEMALE POVERTY
99.7/ 100
METRIC RATING
20th/ 347
METRIC RANK
12.5%
FEMALE POVERTY
95.1/ 100
METRIC RATING
99th/ 347
METRIC RANK
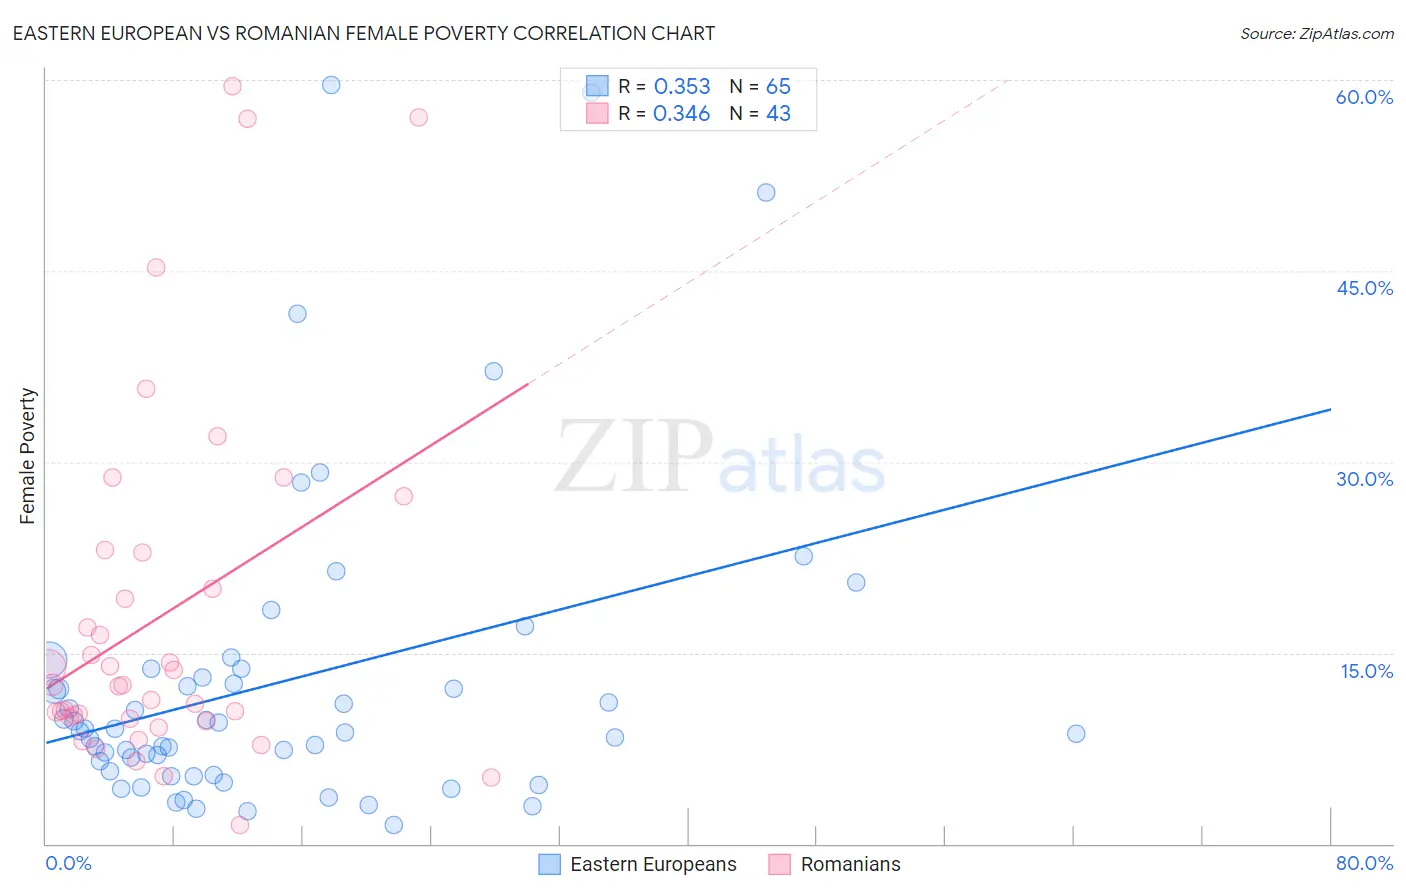
Eastern European vs Romanian Female Poverty Correlation Chart
The statistical analysis conducted on geographies consisting of 460,773,883 people shows a mild positive correlation between the proportion of Eastern Europeans and poverty level among females in the United States with a correlation coefficient (R) of 0.353 and weighted average of 11.5%. Similarly, the statistical analysis conducted on geographies consisting of 377,651,231 people shows a mild positive correlation between the proportion of Romanians and poverty level among females in the United States with a correlation coefficient (R) of 0.346 and weighted average of 12.5%, a difference of 8.3%.
Female Poverty Correlation Summary
| Measurement | Eastern European | Romanian |
| Minimum | 1.4% | 1.5% |
| Maximum | 59.6% | 59.5% |
| Range | 58.2% | 58.0% |
| Mean | 12.7% | 17.9% |
| Median | 8.8% | 12.5% |
| Interquartile 25% (IQ1) | 5.5% | 9.8% |
| Interquartile 75% (IQ3) | 13.4% | 22.9% |
| Interquartile Range (IQR) | 7.9% | 13.1% |
| Standard Deviation (Sample) | 12.4% | 14.2% |
| Standard Deviation (Population) | 12.3% | 14.0% |
Similar Demographics by Female Poverty
Demographics Similar to Eastern Europeans by Female Poverty
In terms of female poverty, the demographic groups most similar to Eastern Europeans are Norwegian (11.5%, a difference of 0.23%), Immigrants from Scotland (11.5%, a difference of 0.27%), Bolivian (11.5%, a difference of 0.32%), Immigrants from Bolivia (11.5%, a difference of 0.39%), and Italian (11.6%, a difference of 0.50%).
| Demographics | Rating | Rank | Female Poverty |
| Immigrants | Lithuania | 99.9 /100 | #13 | Exceptional 11.3% |
| Lithuanians | 99.8 /100 | #14 | Exceptional 11.4% |
| Latvians | 99.8 /100 | #15 | Exceptional 11.4% |
| Immigrants | Bolivia | 99.8 /100 | #16 | Exceptional 11.5% |
| Bolivians | 99.8 /100 | #17 | Exceptional 11.5% |
| Immigrants | Scotland | 99.8 /100 | #18 | Exceptional 11.5% |
| Norwegians | 99.8 /100 | #19 | Exceptional 11.5% |
| Eastern Europeans | 99.7 /100 | #20 | Exceptional 11.5% |
| Italians | 99.7 /100 | #21 | Exceptional 11.6% |
| Swedes | 99.7 /100 | #22 | Exceptional 11.6% |
| Burmese | 99.7 /100 | #23 | Exceptional 11.6% |
| Luxembourgers | 99.7 /100 | #24 | Exceptional 11.6% |
| Immigrants | Northern Europe | 99.6 /100 | #25 | Exceptional 11.6% |
| Croatians | 99.6 /100 | #26 | Exceptional 11.6% |
| Iranians | 99.6 /100 | #27 | Exceptional 11.7% |
Demographics Similar to Romanians by Female Poverty
In terms of female poverty, the demographic groups most similar to Romanians are Native Hawaiian (12.5%, a difference of 0.020%), Australian (12.5%, a difference of 0.050%), British (12.5%, a difference of 0.070%), Immigrants from South Africa (12.5%, a difference of 0.15%), and Immigrants from Latvia (12.5%, a difference of 0.15%).
| Demographics | Rating | Rank | Female Poverty |
| Czechoslovakians | 95.7 /100 | #92 | Exceptional 12.4% |
| Immigrants | Egypt | 95.5 /100 | #93 | Exceptional 12.5% |
| Immigrants | Indonesia | 95.4 /100 | #94 | Exceptional 12.5% |
| Immigrants | South Africa | 95.4 /100 | #95 | Exceptional 12.5% |
| British | 95.2 /100 | #96 | Exceptional 12.5% |
| Australians | 95.2 /100 | #97 | Exceptional 12.5% |
| Native Hawaiians | 95.1 /100 | #98 | Exceptional 12.5% |
| Romanians | 95.1 /100 | #99 | Exceptional 12.5% |
| Immigrants | Latvia | 94.8 /100 | #100 | Exceptional 12.5% |
| Tlingit-Haida | 94.8 /100 | #101 | Exceptional 12.5% |
| Immigrants | China | 94.5 /100 | #102 | Exceptional 12.5% |
| Slavs | 94.5 /100 | #103 | Exceptional 12.5% |
| Palestinians | 94.3 /100 | #104 | Exceptional 12.5% |
| Scottish | 94.1 /100 | #105 | Exceptional 12.5% |
| Immigrants | Turkey | 93.8 /100 | #106 | Exceptional 12.6% |