Eastern European vs Immigrants from India Family Poverty
COMPARE
Eastern European
Immigrants from India
Family Poverty
Family Poverty Comparison
Eastern Europeans
Immigrants from India
7.2%
FAMILY POVERTY
99.7/ 100
METRIC RATING
19th/ 347
METRIC RANK
6.2%
FAMILY POVERTY
100.0/ 100
METRIC RATING
1st/ 347
METRIC RANK
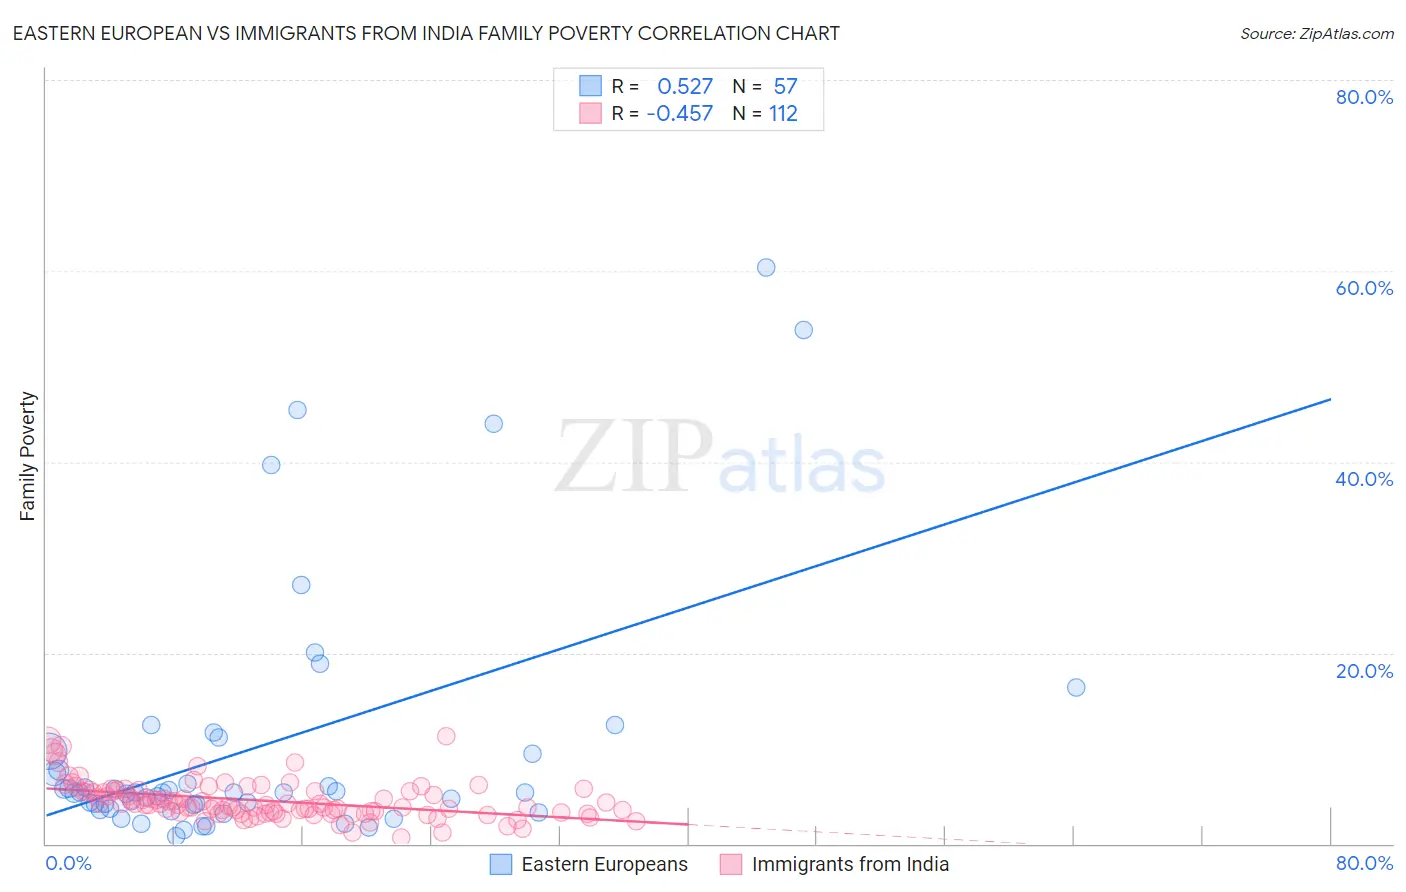
Eastern European vs Immigrants from India Family Poverty Correlation Chart
The statistical analysis conducted on geographies consisting of 459,080,941 people shows a substantial positive correlation between the proportion of Eastern Europeans and poverty level among families in the United States with a correlation coefficient (R) of 0.527 and weighted average of 7.2%. Similarly, the statistical analysis conducted on geographies consisting of 432,464,451 people shows a moderate negative correlation between the proportion of Immigrants from India and poverty level among families in the United States with a correlation coefficient (R) of -0.457 and weighted average of 6.2%, a difference of 16.1%.
Family Poverty Correlation Summary
| Measurement | Eastern European | Immigrants from India |
| Minimum | 0.82% | 0.60% |
| Maximum | 60.3% | 11.3% |
| Range | 59.5% | 10.7% |
| Mean | 10.1% | 4.5% |
| Median | 5.3% | 4.1% |
| Interquartile 25% (IQ1) | 3.8% | 3.2% |
| Interquartile 75% (IQ3) | 9.6% | 5.5% |
| Interquartile Range (IQR) | 5.7% | 2.3% |
| Standard Deviation (Sample) | 13.2% | 1.9% |
| Standard Deviation (Population) | 13.1% | 1.9% |
Demographics Similar to Eastern Europeans and Immigrants from India by Family Poverty
In terms of family poverty, the demographic groups most similar to Eastern Europeans are Immigrants from Hong Kong (7.3%, a difference of 0.16%), Immigrants from Lithuania (7.2%, a difference of 0.30%), Luxembourger (7.2%, a difference of 0.31%), Immigrants from South Central Asia (7.2%, a difference of 0.54%), and Lithuanian (7.2%, a difference of 0.81%). Similarly, the demographic groups most similar to Immigrants from India are Chinese (6.5%, a difference of 4.3%), Immigrants from Taiwan (6.6%, a difference of 6.0%), Filipino (6.6%, a difference of 6.6%), Thai (6.7%, a difference of 7.2%), and Norwegian (6.9%, a difference of 10.5%).
| Demographics | Rating | Rank | Family Poverty |
| Immigrants | India | 100.0 /100 | #1 | Exceptional 6.2% |
| Chinese | 100.0 /100 | #2 | Exceptional 6.5% |
| Immigrants | Taiwan | 100.0 /100 | #3 | Exceptional 6.6% |
| Filipinos | 100.0 /100 | #4 | Exceptional 6.6% |
| Thais | 100.0 /100 | #5 | Exceptional 6.7% |
| Norwegians | 99.9 /100 | #6 | Exceptional 6.9% |
| Immigrants | Ireland | 99.9 /100 | #7 | Exceptional 7.0% |
| Bhutanese | 99.9 /100 | #8 | Exceptional 7.0% |
| Latvians | 99.9 /100 | #9 | Exceptional 7.1% |
| Bulgarians | 99.8 /100 | #10 | Exceptional 7.1% |
| Immigrants | Singapore | 99.8 /100 | #11 | Exceptional 7.1% |
| Maltese | 99.8 /100 | #12 | Exceptional 7.1% |
| Swedes | 99.8 /100 | #13 | Exceptional 7.1% |
| Iranians | 99.8 /100 | #14 | Exceptional 7.1% |
| Lithuanians | 99.8 /100 | #15 | Exceptional 7.2% |
| Immigrants | South Central Asia | 99.8 /100 | #16 | Exceptional 7.2% |
| Luxembourgers | 99.8 /100 | #17 | Exceptional 7.2% |
| Immigrants | Lithuania | 99.8 /100 | #18 | Exceptional 7.2% |
| Eastern Europeans | 99.7 /100 | #19 | Exceptional 7.2% |
| Immigrants | Hong Kong | 99.7 /100 | #20 | Exceptional 7.3% |