Eastern European vs Immigrants from France Female Poverty Among 18-24 Year Olds
COMPARE
Eastern European
Immigrants from France
Female Poverty Among 18-24 Year Olds
Female Poverty Among 18-24 Year Olds Comparison
Eastern Europeans
Immigrants from France
19.9%
FEMALE POVERTY AMONG 18-24 YEAR OLDS
69.3/ 100
METRIC RATING
165th/ 347
METRIC RANK
21.4%
FEMALE POVERTY AMONG 18-24 YEAR OLDS
0.6/ 100
METRIC RATING
259th/ 347
METRIC RANK
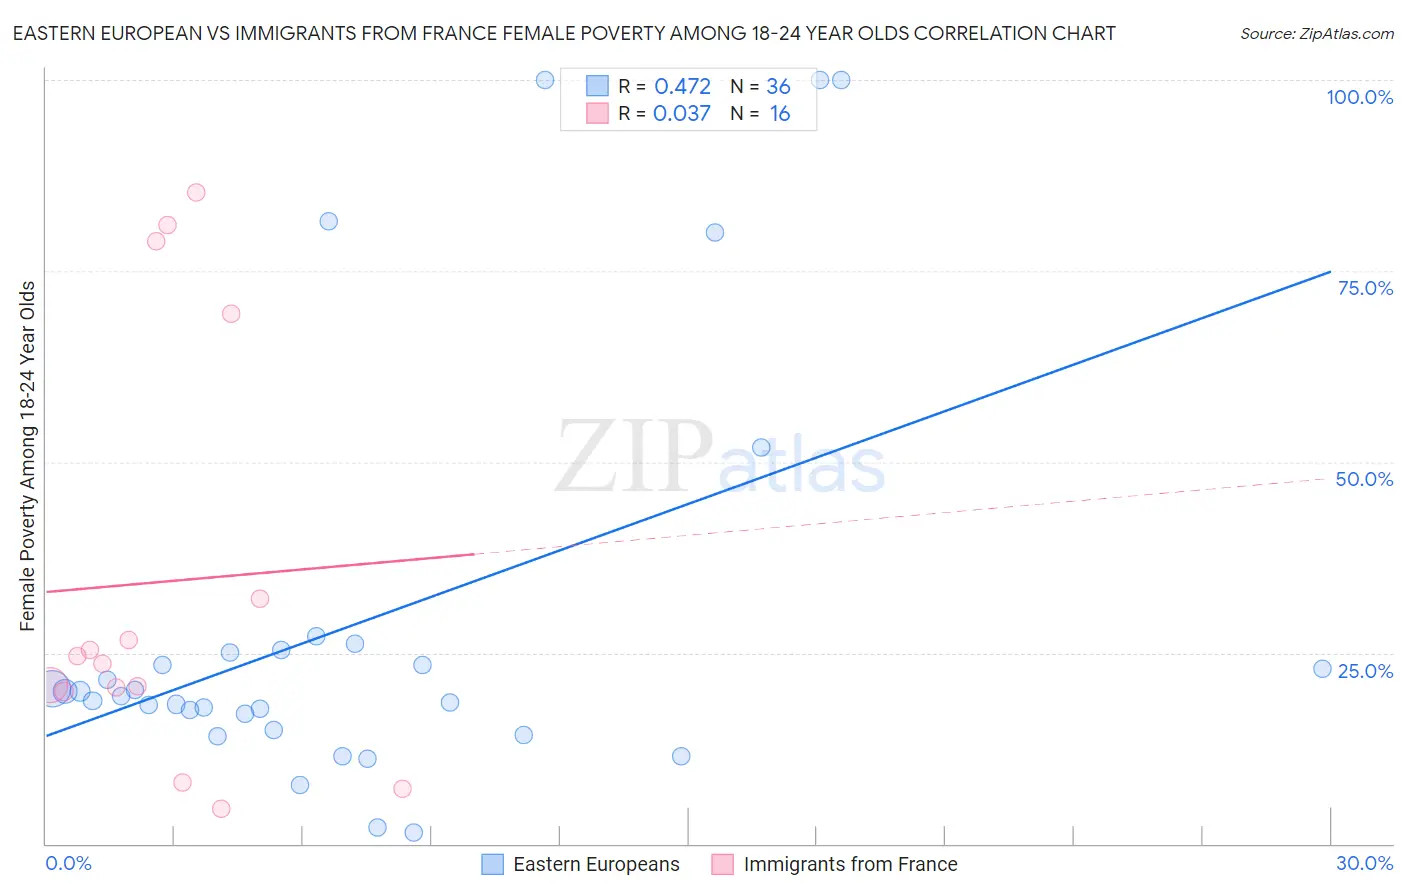
Eastern European vs Immigrants from France Female Poverty Among 18-24 Year Olds Correlation Chart
The statistical analysis conducted on geographies consisting of 442,971,823 people shows a moderate positive correlation between the proportion of Eastern Europeans and poverty level among females between the ages 18 and 24 in the United States with a correlation coefficient (R) of 0.472 and weighted average of 19.9%. Similarly, the statistical analysis conducted on geographies consisting of 282,438,656 people shows no correlation between the proportion of Immigrants from France and poverty level among females between the ages 18 and 24 in the United States with a correlation coefficient (R) of 0.037 and weighted average of 21.4%, a difference of 7.3%.
Female Poverty Among 18-24 Year Olds Correlation Summary
| Measurement | Eastern European | Immigrants from France |
| Minimum | 1.6% | 4.7% |
| Maximum | 100.0% | 85.2% |
| Range | 98.4% | 80.6% |
| Mean | 28.9% | 34.3% |
| Median | 19.7% | 24.1% |
| Interquartile 25% (IQ1) | 16.0% | 20.2% |
| Interquartile 75% (IQ3) | 25.3% | 50.8% |
| Interquartile Range (IQR) | 9.3% | 30.6% |
| Standard Deviation (Sample) | 27.3% | 27.6% |
| Standard Deviation (Population) | 26.9% | 26.7% |
Similar Demographics by Female Poverty Among 18-24 Year Olds
Demographics Similar to Eastern Europeans by Female Poverty Among 18-24 Year Olds
In terms of female poverty among 18-24 year olds, the demographic groups most similar to Eastern Europeans are Belgian (19.9%, a difference of 0.010%), Central American (19.9%, a difference of 0.040%), Malaysian (19.9%, a difference of 0.21%), French Canadian (19.9%, a difference of 0.23%), and Pakistani (19.8%, a difference of 0.30%).
| Demographics | Rating | Rank | Female Poverty Among 18-24 Year Olds |
| Immigrants | Lebanon | 75.3 /100 | #158 | Good 19.8% |
| Trinidadians and Tobagonians | 74.4 /100 | #159 | Good 19.8% |
| Pakistanis | 74.1 /100 | #160 | Good 19.8% |
| Immigrants | Belize | 74.1 /100 | #161 | Good 19.8% |
| French Canadians | 73.0 /100 | #162 | Good 19.9% |
| Malaysians | 72.7 /100 | #163 | Good 19.9% |
| Central Americans | 70.0 /100 | #164 | Good 19.9% |
| Eastern Europeans | 69.3 /100 | #165 | Good 19.9% |
| Belgians | 69.1 /100 | #166 | Good 19.9% |
| Czechoslovakians | 61.8 /100 | #167 | Good 20.0% |
| Fijians | 59.1 /100 | #168 | Average 20.0% |
| Hmong | 55.4 /100 | #169 | Average 20.0% |
| Iranians | 54.7 /100 | #170 | Average 20.1% |
| Immigrants | Nigeria | 54.3 /100 | #171 | Average 20.1% |
| Belizeans | 52.0 /100 | #172 | Average 20.1% |
Demographics Similar to Immigrants from France by Female Poverty Among 18-24 Year Olds
In terms of female poverty among 18-24 year olds, the demographic groups most similar to Immigrants from France are Vietnamese (21.4%, a difference of 0.030%), Immigrants from Norway (21.4%, a difference of 0.050%), Immigrants from Bahamas (21.4%, a difference of 0.12%), Immigrants from Eastern Africa (21.4%, a difference of 0.31%), and Taiwanese (21.2%, a difference of 0.57%).
| Demographics | Rating | Rank | Female Poverty Among 18-24 Year Olds |
| South Africans | 1.6 /100 | #252 | Tragic 21.1% |
| Delaware | 1.6 /100 | #253 | Tragic 21.1% |
| British West Indians | 1.2 /100 | #254 | Tragic 21.2% |
| Immigrants | Grenada | 1.2 /100 | #255 | Tragic 21.2% |
| Tsimshian | 1.0 /100 | #256 | Tragic 21.2% |
| Taiwanese | 1.0 /100 | #257 | Tragic 21.2% |
| Vietnamese | 0.6 /100 | #258 | Tragic 21.4% |
| Immigrants | France | 0.6 /100 | #259 | Tragic 21.4% |
| Immigrants | Norway | 0.6 /100 | #260 | Tragic 21.4% |
| Immigrants | Bahamas | 0.5 /100 | #261 | Tragic 21.4% |
| Immigrants | Eastern Africa | 0.4 /100 | #262 | Tragic 21.4% |
| Icelanders | 0.3 /100 | #263 | Tragic 21.5% |
| Hondurans | 0.3 /100 | #264 | Tragic 21.5% |
| Immigrants | Nonimmigrants | 0.3 /100 | #265 | Tragic 21.5% |
| Alaska Natives | 0.3 /100 | #266 | Tragic 21.5% |