Dutch West Indian vs Immigrants from Panama Female Poverty Among 25-34 Year Olds
COMPARE
Dutch West Indian
Immigrants from Panama
Female Poverty Among 25-34 Year Olds
Female Poverty Among 25-34 Year Olds Comparison
Dutch West Indians
Immigrants from Panama
18.4%
FEMALE POVERTY AMONG 25-34 YEAR OLDS
0.0/ 100
METRIC RATING
324th/ 347
METRIC RANK
14.1%
FEMALE POVERTY AMONG 25-34 YEAR OLDS
11.6/ 100
METRIC RATING
208th/ 347
METRIC RANK
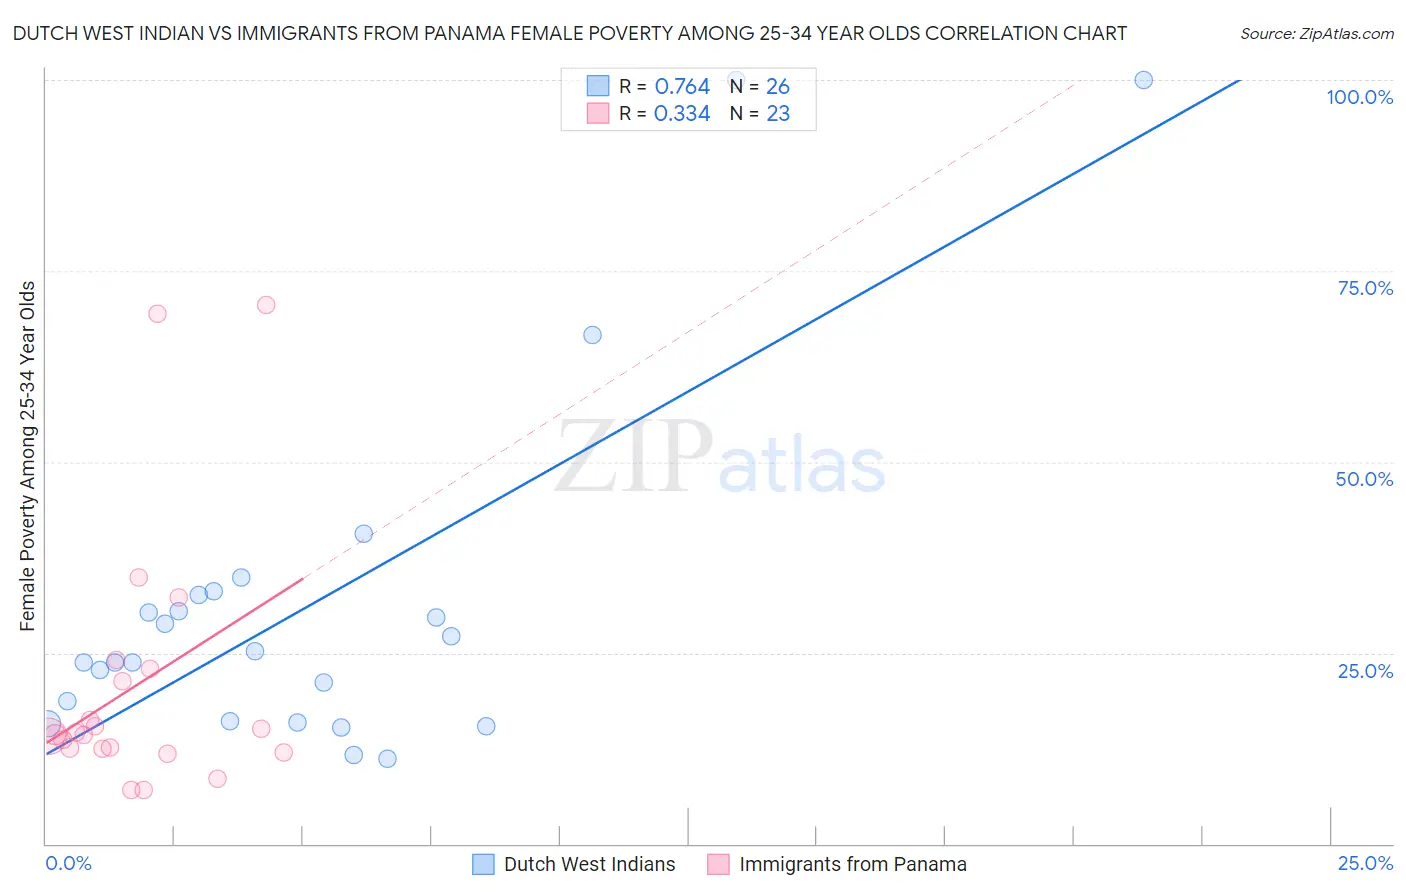
Dutch West Indian vs Immigrants from Panama Female Poverty Among 25-34 Year Olds Correlation Chart
The statistical analysis conducted on geographies consisting of 85,426,619 people shows a strong positive correlation between the proportion of Dutch West Indians and poverty level among females between the ages 25 and 34 in the United States with a correlation coefficient (R) of 0.764 and weighted average of 18.4%. Similarly, the statistical analysis conducted on geographies consisting of 219,926,572 people shows a mild positive correlation between the proportion of Immigrants from Panama and poverty level among females between the ages 25 and 34 in the United States with a correlation coefficient (R) of 0.334 and weighted average of 14.1%, a difference of 30.7%.
Female Poverty Among 25-34 Year Olds Correlation Summary
| Measurement | Dutch West Indian | Immigrants from Panama |
| Minimum | 11.1% | 7.0% |
| Maximum | 100.0% | 70.5% |
| Range | 88.9% | 63.5% |
| Mean | 31.3% | 20.7% |
| Median | 24.5% | 14.3% |
| Interquartile 25% (IQ1) | 16.1% | 12.4% |
| Interquartile 75% (IQ3) | 32.6% | 22.9% |
| Interquartile Range (IQR) | 16.5% | 10.5% |
| Standard Deviation (Sample) | 23.1% | 17.0% |
| Standard Deviation (Population) | 22.7% | 16.7% |
Similar Demographics by Female Poverty Among 25-34 Year Olds
Demographics Similar to Dutch West Indians by Female Poverty Among 25-34 Year Olds
In terms of female poverty among 25-34 year olds, the demographic groups most similar to Dutch West Indians are Inupiat (18.5%, a difference of 0.52%), Seminole (18.3%, a difference of 0.95%), Central American Indian (18.2%, a difference of 1.3%), Choctaw (18.1%, a difference of 2.1%), and Chippewa (18.0%, a difference of 2.4%).
| Demographics | Rating | Rank | Female Poverty Among 25-34 Year Olds |
| Arapaho | 0.0 /100 | #317 | Tragic 17.8% |
| Ute | 0.0 /100 | #318 | Tragic 17.9% |
| Menominee | 0.0 /100 | #319 | Tragic 18.0% |
| Chippewa | 0.0 /100 | #320 | Tragic 18.0% |
| Choctaw | 0.0 /100 | #321 | Tragic 18.1% |
| Central American Indians | 0.0 /100 | #322 | Tragic 18.2% |
| Seminole | 0.0 /100 | #323 | Tragic 18.3% |
| Dutch West Indians | 0.0 /100 | #324 | Tragic 18.4% |
| Inupiat | 0.0 /100 | #325 | Tragic 18.5% |
| Blacks/African Americans | 0.0 /100 | #326 | Tragic 18.9% |
| Cheyenne | 0.0 /100 | #327 | Tragic 19.1% |
| Alaskan Athabascans | 0.0 /100 | #328 | Tragic 19.1% |
| Creek | 0.0 /100 | #329 | Tragic 19.2% |
| Paiute | 0.0 /100 | #330 | Tragic 19.6% |
| Kiowa | 0.0 /100 | #331 | Tragic 19.7% |
Demographics Similar to Immigrants from Panama by Female Poverty Among 25-34 Year Olds
In terms of female poverty among 25-34 year olds, the demographic groups most similar to Immigrants from Panama are Japanese (14.1%, a difference of 0.020%), Hungarian (14.1%, a difference of 0.040%), Immigrants from Africa (14.1%, a difference of 0.32%), Hawaiian (14.1%, a difference of 0.37%), and Immigrants (14.0%, a difference of 0.51%).
| Demographics | Rating | Rank | Female Poverty Among 25-34 Year Olds |
| Immigrants | Trinidad and Tobago | 17.6 /100 | #201 | Poor 14.0% |
| Welsh | 17.2 /100 | #202 | Poor 14.0% |
| Immigrants | Immigrants | 14.5 /100 | #203 | Poor 14.0% |
| Hawaiians | 13.6 /100 | #204 | Poor 14.1% |
| Immigrants | Africa | 13.4 /100 | #205 | Poor 14.1% |
| Hungarians | 11.8 /100 | #206 | Poor 14.1% |
| Japanese | 11.7 /100 | #207 | Poor 14.1% |
| Immigrants | Panama | 11.6 /100 | #208 | Poor 14.1% |
| Guyanese | 8.6 /100 | #209 | Tragic 14.2% |
| Panamanians | 8.6 /100 | #210 | Tragic 14.2% |
| Trinidadians and Tobagonians | 8.2 /100 | #211 | Tragic 14.2% |
| Immigrants | Guyana | 6.6 /100 | #212 | Tragic 14.3% |
| Puget Sound Salish | 6.5 /100 | #213 | Tragic 14.3% |
| French | 6.2 /100 | #214 | Tragic 14.3% |
| Immigrants | Nigeria | 6.2 /100 | #215 | Tragic 14.3% |