Dutch West Indian vs Immigrants from Nicaragua Male Poverty
COMPARE
Dutch West Indian
Immigrants from Nicaragua
Male Poverty
Male Poverty Comparison
Dutch West Indians
Immigrants from Nicaragua
14.2%
MALE POVERTY
0.0/ 100
METRIC RATING
307th/ 347
METRIC RANK
12.9%
MALE POVERTY
0.2/ 100
METRIC RATING
250th/ 347
METRIC RANK
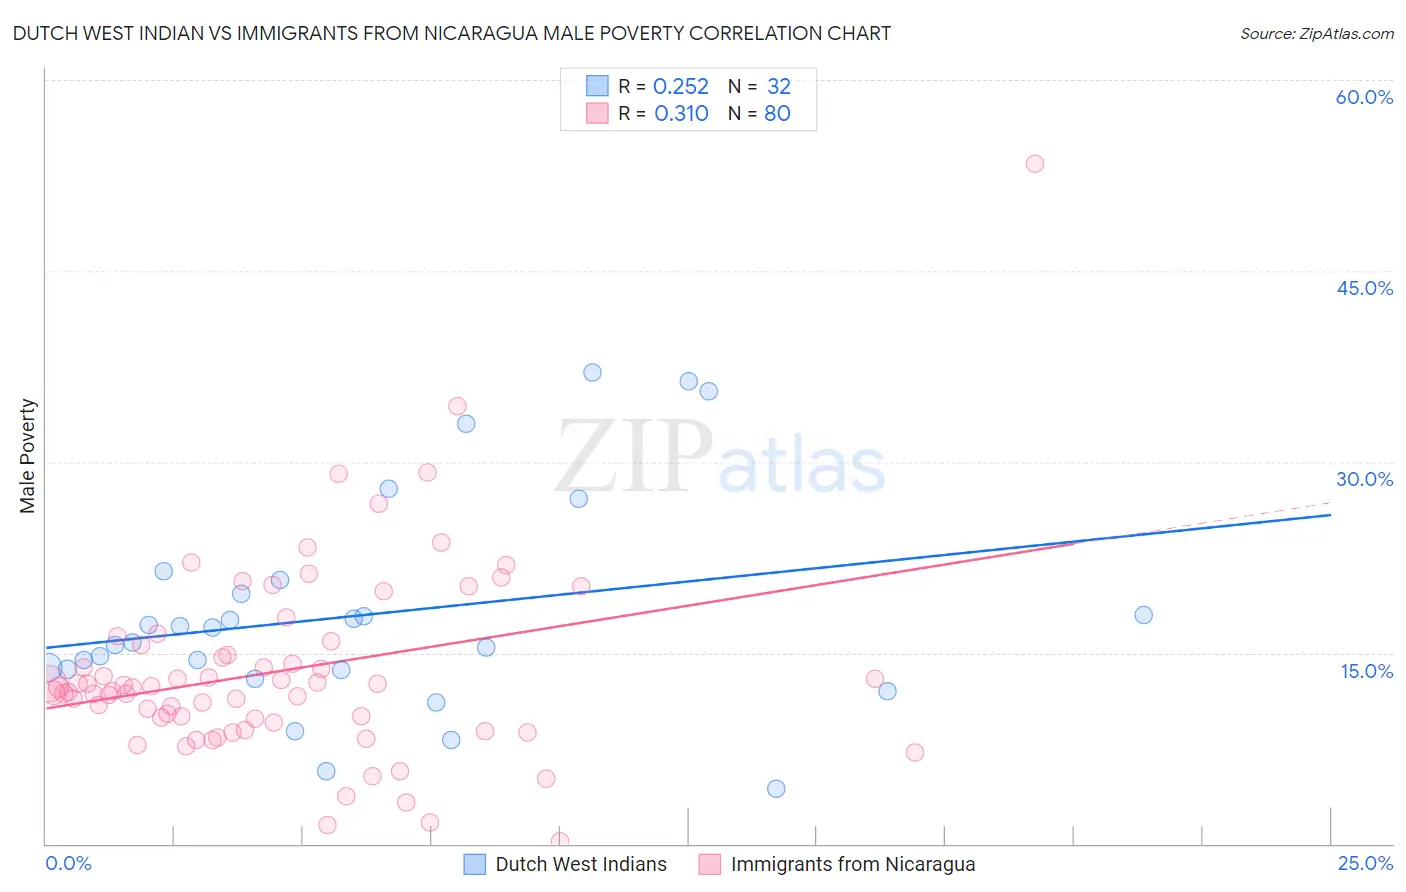
Dutch West Indian vs Immigrants from Nicaragua Male Poverty Correlation Chart
The statistical analysis conducted on geographies consisting of 85,761,209 people shows a weak positive correlation between the proportion of Dutch West Indians and poverty level among males in the United States with a correlation coefficient (R) of 0.252 and weighted average of 14.2%. Similarly, the statistical analysis conducted on geographies consisting of 236,310,825 people shows a mild positive correlation between the proportion of Immigrants from Nicaragua and poverty level among males in the United States with a correlation coefficient (R) of 0.310 and weighted average of 12.9%, a difference of 10.1%.
Male Poverty Correlation Summary
| Measurement | Dutch West Indian | Immigrants from Nicaragua |
| Minimum | 4.3% | 0.19% |
| Maximum | 37.0% | 53.4% |
| Range | 32.7% | 53.2% |
| Mean | 18.0% | 13.6% |
| Median | 16.4% | 12.3% |
| Interquartile 25% (IQ1) | 13.7% | 9.7% |
| Interquartile 75% (IQ3) | 20.2% | 15.8% |
| Interquartile Range (IQR) | 6.5% | 6.1% |
| Standard Deviation (Sample) | 8.4% | 7.7% |
| Standard Deviation (Population) | 8.2% | 7.7% |
Similar Demographics by Male Poverty
Demographics Similar to Dutch West Indians by Male Poverty
In terms of male poverty, the demographic groups most similar to Dutch West Indians are African (14.2%, a difference of 0.020%), Somali (14.3%, a difference of 0.40%), Seminole (14.3%, a difference of 0.60%), Creek (14.1%, a difference of 0.70%), and Immigrants from Bangladesh (14.1%, a difference of 0.77%).
| Demographics | Rating | Rank | Male Poverty |
| Immigrants | Mexico | 0.0 /100 | #300 | Tragic 14.0% |
| Immigrants | Senegal | 0.0 /100 | #301 | Tragic 14.0% |
| Immigrants | Caribbean | 0.0 /100 | #302 | Tragic 14.0% |
| Bahamians | 0.0 /100 | #303 | Tragic 14.1% |
| Senegalese | 0.0 /100 | #304 | Tragic 14.1% |
| Immigrants | Bangladesh | 0.0 /100 | #305 | Tragic 14.1% |
| Creek | 0.0 /100 | #306 | Tragic 14.1% |
| Dutch West Indians | 0.0 /100 | #307 | Tragic 14.2% |
| Africans | 0.0 /100 | #308 | Tragic 14.2% |
| Somalis | 0.0 /100 | #309 | Tragic 14.3% |
| Seminole | 0.0 /100 | #310 | Tragic 14.3% |
| Hondurans | 0.0 /100 | #311 | Tragic 14.3% |
| Choctaw | 0.0 /100 | #312 | Tragic 14.4% |
| Immigrants | Somalia | 0.0 /100 | #313 | Tragic 14.6% |
| Immigrants | Honduras | 0.0 /100 | #314 | Tragic 14.6% |
Demographics Similar to Immigrants from Nicaragua by Male Poverty
In terms of male poverty, the demographic groups most similar to Immigrants from Nicaragua are Potawatomi (12.9%, a difference of 0.010%), Immigrants from Sudan (12.9%, a difference of 0.080%), Immigrants from Cuba (12.9%, a difference of 0.10%), Immigrants from Ecuador (12.9%, a difference of 0.13%), and Immigrants from Western Africa (12.9%, a difference of 0.14%).
| Demographics | Rating | Rank | Male Poverty |
| Alaskan Athabascans | 0.3 /100 | #243 | Tragic 12.8% |
| Tsimshian | 0.3 /100 | #244 | Tragic 12.8% |
| Liberians | 0.3 /100 | #245 | Tragic 12.8% |
| Immigrants | El Salvador | 0.2 /100 | #246 | Tragic 12.8% |
| Immigrants | Western Africa | 0.2 /100 | #247 | Tragic 12.9% |
| Immigrants | Sudan | 0.2 /100 | #248 | Tragic 12.9% |
| Potawatomi | 0.2 /100 | #249 | Tragic 12.9% |
| Immigrants | Nicaragua | 0.2 /100 | #250 | Tragic 12.9% |
| Immigrants | Cuba | 0.2 /100 | #251 | Tragic 12.9% |
| Immigrants | Ecuador | 0.2 /100 | #252 | Tragic 12.9% |
| Immigrants | Ghana | 0.2 /100 | #253 | Tragic 12.9% |
| Mexican American Indians | 0.1 /100 | #254 | Tragic 13.0% |
| Immigrants | Liberia | 0.1 /100 | #255 | Tragic 13.0% |
| Immigrants | Burma/Myanmar | 0.1 /100 | #256 | Tragic 13.0% |
| Immigrants | Trinidad and Tobago | 0.1 /100 | #257 | Tragic 13.1% |