Dutch West Indian vs Immigrants from Latvia Female Poverty Among 18-24 Year Olds
COMPARE
Dutch West Indian
Immigrants from Latvia
Female Poverty Among 18-24 Year Olds
Female Poverty Among 18-24 Year Olds Comparison
Dutch West Indians
Immigrants from Latvia
24.5%
FEMALE POVERTY AMONG 18-24 YEAR OLDS
0.0/ 100
METRIC RATING
319th/ 347
METRIC RANK
20.4%
FEMALE POVERTY AMONG 18-24 YEAR OLDS
23.0/ 100
METRIC RATING
195th/ 347
METRIC RANK
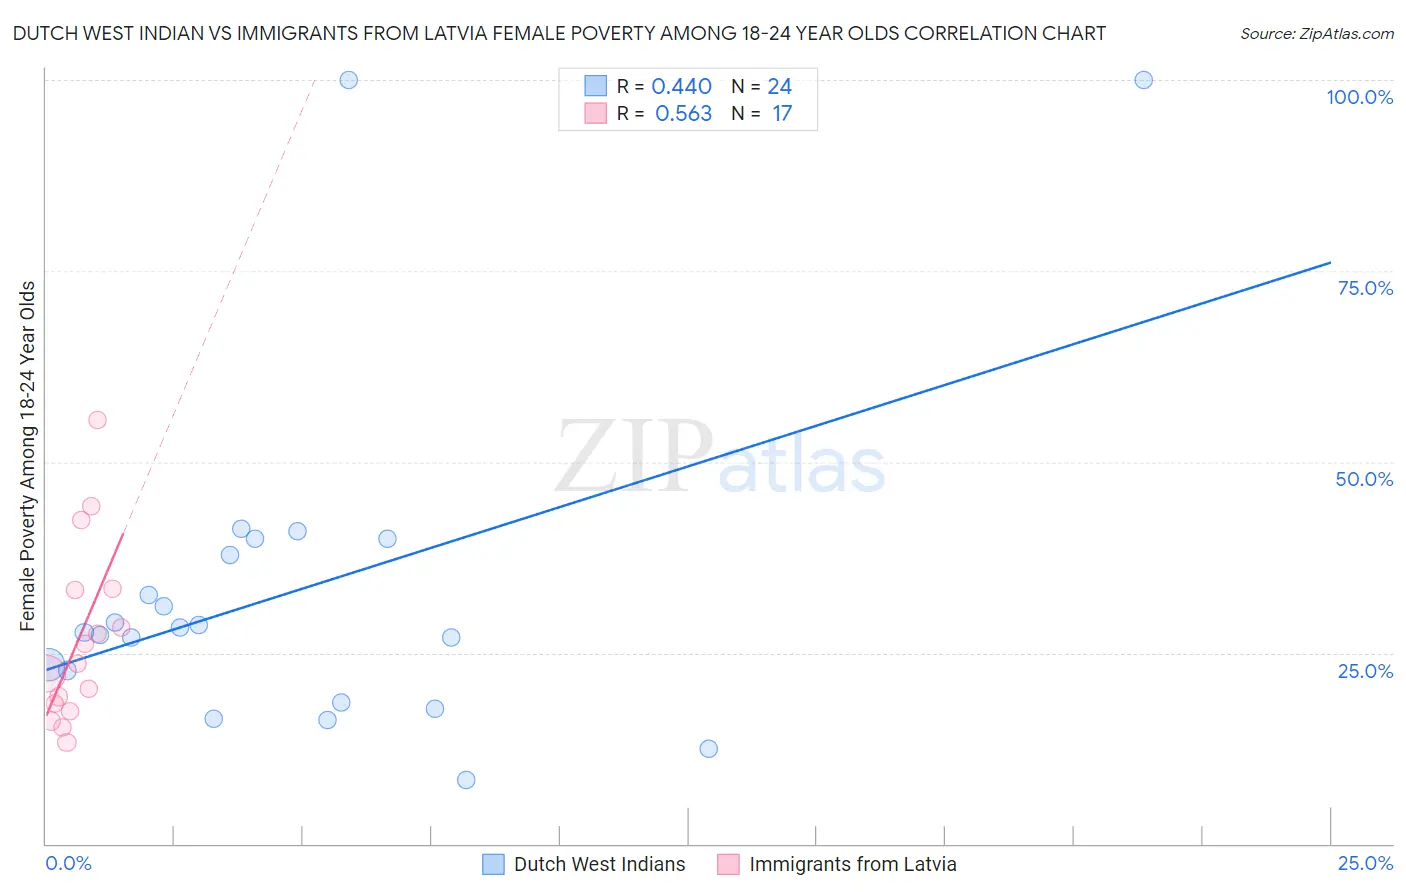
Dutch West Indian vs Immigrants from Latvia Female Poverty Among 18-24 Year Olds Correlation Chart
The statistical analysis conducted on geographies consisting of 85,171,032 people shows a moderate positive correlation between the proportion of Dutch West Indians and poverty level among females between the ages 18 and 24 in the United States with a correlation coefficient (R) of 0.440 and weighted average of 24.5%. Similarly, the statistical analysis conducted on geographies consisting of 112,426,686 people shows a substantial positive correlation between the proportion of Immigrants from Latvia and poverty level among females between the ages 18 and 24 in the United States with a correlation coefficient (R) of 0.563 and weighted average of 20.4%, a difference of 20.1%.
Female Poverty Among 18-24 Year Olds Correlation Summary
| Measurement | Dutch West Indian | Immigrants from Latvia |
| Minimum | 8.3% | 13.2% |
| Maximum | 100.0% | 55.5% |
| Range | 91.7% | 42.3% |
| Mean | 33.1% | 26.8% |
| Median | 28.0% | 23.5% |
| Interquartile 25% (IQ1) | 20.6% | 17.9% |
| Interquartile 75% (IQ3) | 38.9% | 33.3% |
| Interquartile Range (IQR) | 18.3% | 15.4% |
| Standard Deviation (Sample) | 22.5% | 11.7% |
| Standard Deviation (Population) | 22.0% | 11.3% |
Similar Demographics by Female Poverty Among 18-24 Year Olds
Demographics Similar to Dutch West Indians by Female Poverty Among 18-24 Year Olds
In terms of female poverty among 18-24 year olds, the demographic groups most similar to Dutch West Indians are Chickasaw (24.5%, a difference of 0.10%), Osage (24.5%, a difference of 0.18%), Immigrants from Congo (24.6%, a difference of 0.30%), Alsatian (24.4%, a difference of 0.48%), and Black/African American (24.3%, a difference of 0.79%).
| Demographics | Rating | Rank | Female Poverty Among 18-24 Year Olds |
| Yuman | 0.0 /100 | #312 | Tragic 24.0% |
| Creek | 0.0 /100 | #313 | Tragic 24.2% |
| Choctaw | 0.0 /100 | #314 | Tragic 24.3% |
| Blacks/African Americans | 0.0 /100 | #315 | Tragic 24.3% |
| Alsatians | 0.0 /100 | #316 | Tragic 24.4% |
| Osage | 0.0 /100 | #317 | Tragic 24.5% |
| Chickasaw | 0.0 /100 | #318 | Tragic 24.5% |
| Dutch West Indians | 0.0 /100 | #319 | Tragic 24.5% |
| Immigrants | Congo | 0.0 /100 | #320 | Tragic 24.6% |
| Immigrants | Zaire | 0.0 /100 | #321 | Tragic 25.1% |
| Somalis | 0.0 /100 | #322 | Tragic 25.1% |
| Arapaho | 0.0 /100 | #323 | Tragic 25.2% |
| German Russians | 0.0 /100 | #324 | Tragic 25.2% |
| Immigrants | Saudi Arabia | 0.0 /100 | #325 | Tragic 25.3% |
| Yakama | 0.0 /100 | #326 | Tragic 25.3% |
Demographics Similar to Immigrants from Latvia by Female Poverty Among 18-24 Year Olds
In terms of female poverty among 18-24 year olds, the demographic groups most similar to Immigrants from Latvia are Mexican American Indian (20.4%, a difference of 0.010%), Nigerian (20.4%, a difference of 0.030%), Czech (20.4%, a difference of 0.050%), Immigrants from Israel (20.4%, a difference of 0.10%), and Zimbabwean (20.4%, a difference of 0.14%).
| Demographics | Rating | Rank | Female Poverty Among 18-24 Year Olds |
| Scandinavians | 34.6 /100 | #188 | Fair 20.3% |
| Immigrants | Germany | 34.0 /100 | #189 | Fair 20.3% |
| Immigrants | Western Asia | 29.3 /100 | #190 | Fair 20.3% |
| Moroccans | 25.8 /100 | #191 | Fair 20.4% |
| Immigrants | Israel | 24.4 /100 | #192 | Fair 20.4% |
| Nigerians | 23.4 /100 | #193 | Fair 20.4% |
| Mexican American Indians | 23.2 /100 | #194 | Fair 20.4% |
| Immigrants | Latvia | 23.0 /100 | #195 | Fair 20.4% |
| Czechs | 22.3 /100 | #196 | Fair 20.4% |
| Zimbabweans | 21.0 /100 | #197 | Fair 20.4% |
| Immigrants | Spain | 20.7 /100 | #198 | Fair 20.4% |
| Germans | 20.6 /100 | #199 | Fair 20.4% |
| Europeans | 19.9 /100 | #200 | Poor 20.4% |
| Mexicans | 18.3 /100 | #201 | Poor 20.5% |
| Immigrants | Turkey | 17.7 /100 | #202 | Poor 20.5% |