Dutch vs Immigrants from South America Female Poverty Among 18-24 Year Olds
COMPARE
Dutch
Immigrants from South America
Female Poverty Among 18-24 Year Olds
Female Poverty Among 18-24 Year Olds Comparison
Dutch
Immigrants from South America
20.5%
FEMALE POVERTY AMONG 18-24 YEAR OLDS
15.9/ 100
METRIC RATING
208th/ 347
METRIC RANK
17.9%
FEMALE POVERTY AMONG 18-24 YEAR OLDS
100.0/ 100
METRIC RATING
36th/ 347
METRIC RANK
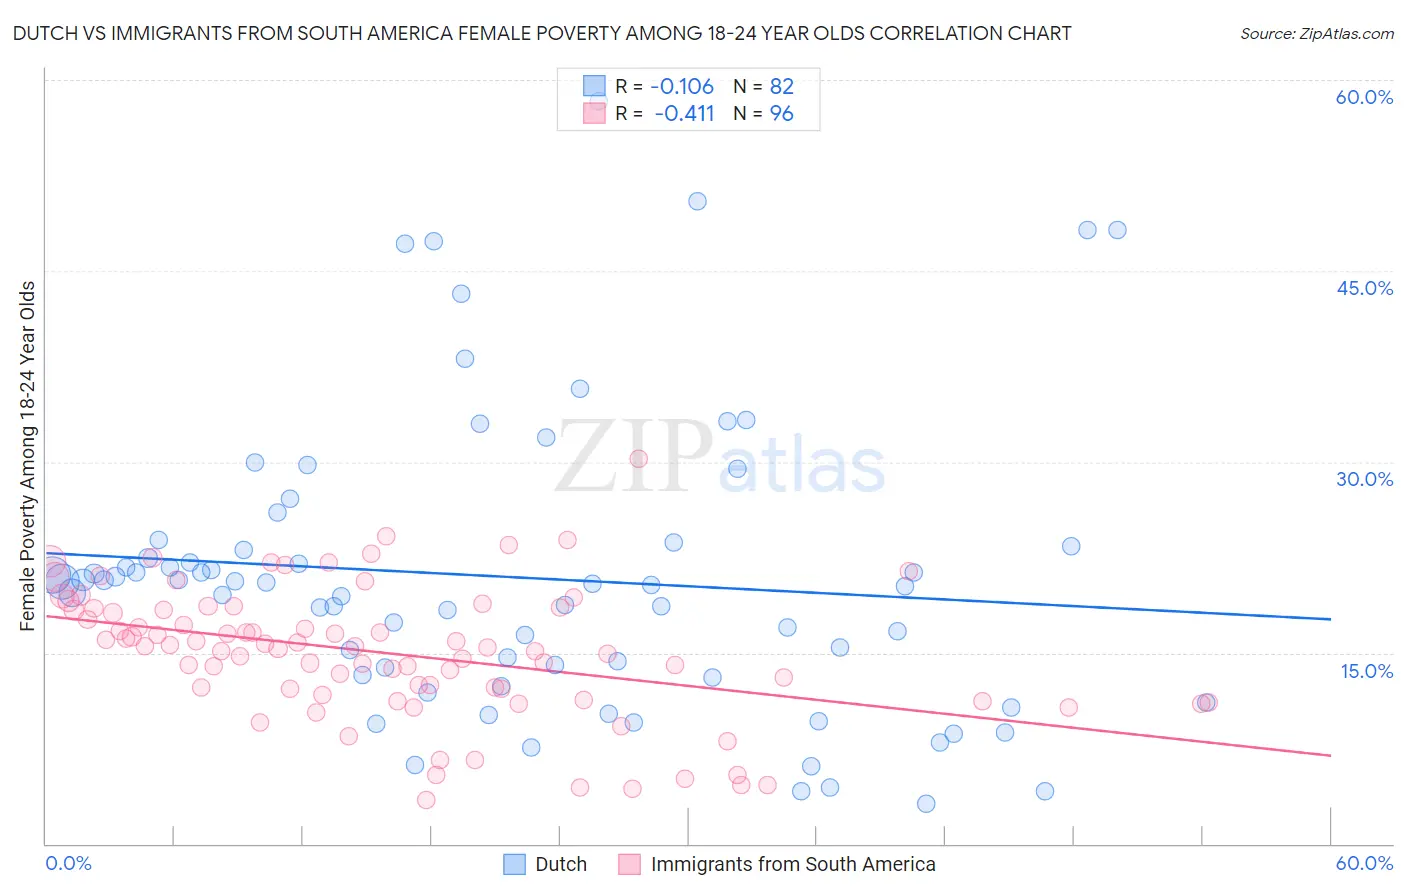
Dutch vs Immigrants from South America Female Poverty Among 18-24 Year Olds Correlation Chart
The statistical analysis conducted on geographies consisting of 523,124,307 people shows a poor negative correlation between the proportion of Dutch and poverty level among females between the ages 18 and 24 in the United States with a correlation coefficient (R) of -0.106 and weighted average of 20.5%. Similarly, the statistical analysis conducted on geographies consisting of 468,818,537 people shows a moderate negative correlation between the proportion of Immigrants from South America and poverty level among females between the ages 18 and 24 in the United States with a correlation coefficient (R) of -0.411 and weighted average of 17.9%, a difference of 14.6%.
Female Poverty Among 18-24 Year Olds Correlation Summary
| Measurement | Dutch | Immigrants from South America |
| Minimum | 3.2% | 3.5% |
| Maximum | 58.3% | 30.2% |
| Range | 55.1% | 26.7% |
| Mean | 20.9% | 15.0% |
| Median | 20.4% | 15.5% |
| Interquartile 25% (IQ1) | 13.2% | 11.9% |
| Interquartile 75% (IQ3) | 23.3% | 18.4% |
| Interquartile Range (IQR) | 10.1% | 6.5% |
| Standard Deviation (Sample) | 11.5% | 5.2% |
| Standard Deviation (Population) | 11.4% | 5.2% |
Similar Demographics by Female Poverty Among 18-24 Year Olds
Demographics Similar to Dutch by Female Poverty Among 18-24 Year Olds
In terms of female poverty among 18-24 year olds, the demographic groups most similar to Dutch are Arab (20.5%, a difference of 0.030%), Spaniard (20.5%, a difference of 0.040%), English (20.5%, a difference of 0.070%), Hispanic or Latino (20.5%, a difference of 0.070%), and Immigrants from Netherlands (20.5%, a difference of 0.10%).
| Demographics | Rating | Rank | Female Poverty Among 18-24 Year Olds |
| Mexicans | 18.3 /100 | #201 | Poor 20.5% |
| Immigrants | Turkey | 17.7 /100 | #202 | Poor 20.5% |
| Immigrants | Malaysia | 17.2 /100 | #203 | Poor 20.5% |
| Immigrants | Netherlands | 17.0 /100 | #204 | Poor 20.5% |
| English | 16.7 /100 | #205 | Poor 20.5% |
| Hispanics or Latinos | 16.6 /100 | #206 | Poor 20.5% |
| Spaniards | 16.3 /100 | #207 | Poor 20.5% |
| Dutch | 15.9 /100 | #208 | Poor 20.5% |
| Arabs | 15.5 /100 | #209 | Poor 20.5% |
| Immigrants | Ghana | 14.3 /100 | #210 | Poor 20.5% |
| Immigrants | Western Europe | 13.5 /100 | #211 | Poor 20.6% |
| Liberians | 11.6 /100 | #212 | Poor 20.6% |
| Northern Europeans | 11.6 /100 | #213 | Poor 20.6% |
| Immigrants | South Africa | 10.7 /100 | #214 | Poor 20.6% |
| Spanish | 10.4 /100 | #215 | Poor 20.6% |
Demographics Similar to Immigrants from South America by Female Poverty Among 18-24 Year Olds
In terms of female poverty among 18-24 year olds, the demographic groups most similar to Immigrants from South America are Immigrants from Greece (17.9%, a difference of 0.050%), Immigrants from Croatia (17.9%, a difference of 0.060%), Immigrants from Nicaragua (17.9%, a difference of 0.090%), Native Hawaiian (17.9%, a difference of 0.20%), and Immigrants from Moldova (17.9%, a difference of 0.23%).
| Demographics | Rating | Rank | Female Poverty Among 18-24 Year Olds |
| Portuguese | 100.0 /100 | #29 | Exceptional 17.8% |
| Immigrants | South Eastern Asia | 100.0 /100 | #30 | Exceptional 17.8% |
| Immigrants | Vietnam | 100.0 /100 | #31 | Exceptional 17.8% |
| Immigrants | Moldova | 100.0 /100 | #32 | Exceptional 17.9% |
| Native Hawaiians | 100.0 /100 | #33 | Exceptional 17.9% |
| Immigrants | Nicaragua | 100.0 /100 | #34 | Exceptional 17.9% |
| Immigrants | Greece | 100.0 /100 | #35 | Exceptional 17.9% |
| Immigrants | South America | 100.0 /100 | #36 | Exceptional 17.9% |
| Immigrants | Croatia | 100.0 /100 | #37 | Exceptional 17.9% |
| South Americans | 100.0 /100 | #38 | Exceptional 18.0% |
| Puget Sound Salish | 100.0 /100 | #39 | Exceptional 18.0% |
| Immigrants | Romania | 100.0 /100 | #40 | Exceptional 18.0% |
| Immigrants | Argentina | 100.0 /100 | #41 | Exceptional 18.0% |
| Bulgarians | 100.0 /100 | #42 | Exceptional 18.1% |
| Macedonians | 100.0 /100 | #43 | Exceptional 18.1% |