Dutch vs Immigrants from Oceania Female Poverty Among 25-34 Year Olds
COMPARE
Dutch
Immigrants from Oceania
Female Poverty Among 25-34 Year Olds
Female Poverty Among 25-34 Year Olds Comparison
Dutch
Immigrants from Oceania
13.8%
FEMALE POVERTY AMONG 25-34 YEAR OLDS
29.7/ 100
METRIC RATING
190th/ 347
METRIC RANK
13.5%
FEMALE POVERTY AMONG 25-34 YEAR OLDS
50.0/ 100
METRIC RATING
174th/ 347
METRIC RANK
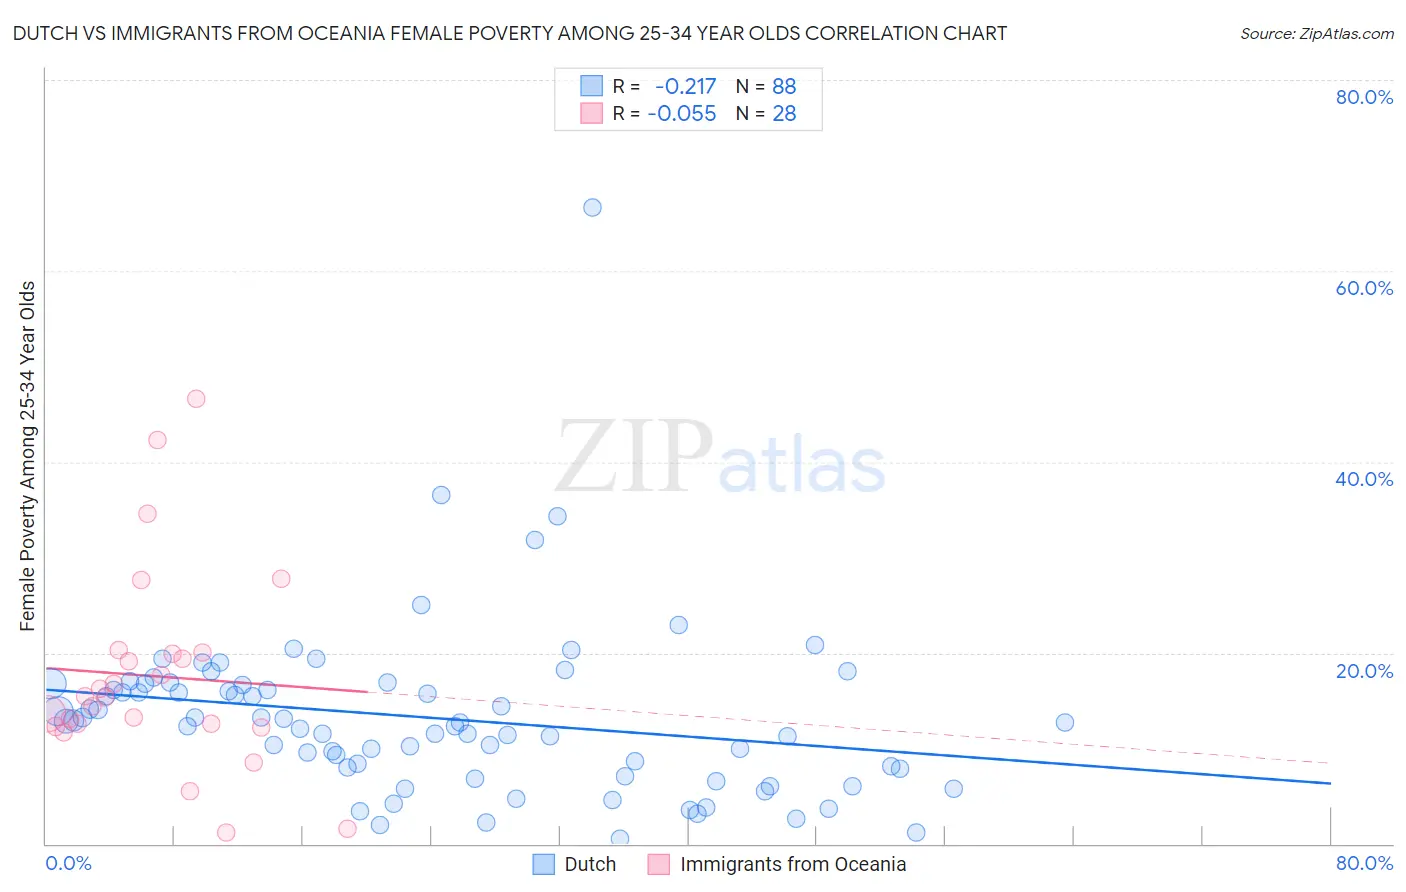
Dutch vs Immigrants from Oceania Female Poverty Among 25-34 Year Olds Correlation Chart
The statistical analysis conducted on geographies consisting of 534,381,928 people shows a weak negative correlation between the proportion of Dutch and poverty level among females between the ages 25 and 34 in the United States with a correlation coefficient (R) of -0.217 and weighted average of 13.8%. Similarly, the statistical analysis conducted on geographies consisting of 301,478,859 people shows a slight negative correlation between the proportion of Immigrants from Oceania and poverty level among females between the ages 25 and 34 in the United States with a correlation coefficient (R) of -0.055 and weighted average of 13.5%, a difference of 1.8%.
Female Poverty Among 25-34 Year Olds Correlation Summary
| Measurement | Dutch | Immigrants from Oceania |
| Minimum | 0.50% | 1.2% |
| Maximum | 66.7% | 46.7% |
| Range | 66.2% | 45.4% |
| Mean | 13.2% | 17.6% |
| Median | 12.7% | 15.4% |
| Interquartile 25% (IQ1) | 7.9% | 12.4% |
| Interquartile 75% (IQ3) | 16.7% | 19.9% |
| Interquartile Range (IQR) | 8.8% | 7.5% |
| Standard Deviation (Sample) | 8.9% | 10.5% |
| Standard Deviation (Population) | 8.9% | 10.3% |
Demographics Similar to Dutch and Immigrants from Oceania by Female Poverty Among 25-34 Year Olds
In terms of female poverty among 25-34 year olds, the demographic groups most similar to Dutch are Immigrants from St. Vincent and the Grenadines (13.8%, a difference of 0.040%), Tlingit-Haida (13.8%, a difference of 0.16%), Finnish (13.7%, a difference of 0.26%), Immigrants from Eritrea (13.7%, a difference of 0.28%), and Immigrants from Uruguay (13.7%, a difference of 0.41%). Similarly, the demographic groups most similar to Immigrants from Oceania are Kenyan (13.5%, a difference of 0.15%), Immigrants from Costa Rica (13.5%, a difference of 0.16%), Bermudan (13.6%, a difference of 0.26%), Yugoslavian (13.6%, a difference of 0.42%), and Venezuelan (13.6%, a difference of 0.45%).
| Demographics | Rating | Rank | Female Poverty Among 25-34 Year Olds |
| Immigrants | Costa Rica | 51.9 /100 | #172 | Average 13.5% |
| Kenyans | 51.8 /100 | #173 | Average 13.5% |
| Immigrants | Oceania | 50.0 /100 | #174 | Average 13.5% |
| Bermudans | 46.8 /100 | #175 | Average 13.6% |
| Yugoslavians | 45.0 /100 | #176 | Average 13.6% |
| Venezuelans | 44.6 /100 | #177 | Average 13.6% |
| Canadians | 44.3 /100 | #178 | Average 13.6% |
| Immigrants | Eastern Africa | 43.6 /100 | #179 | Average 13.6% |
| Germans | 41.6 /100 | #180 | Average 13.6% |
| Guamanians/Chamorros | 41.5 /100 | #181 | Average 13.6% |
| Immigrants | Venezuela | 40.7 /100 | #182 | Average 13.6% |
| Portuguese | 40.3 /100 | #183 | Average 13.6% |
| Czechoslovakians | 36.8 /100 | #184 | Fair 13.7% |
| Irish | 35.3 /100 | #185 | Fair 13.7% |
| Immigrants | Uruguay | 34.1 /100 | #186 | Fair 13.7% |
| Slovaks | 34.1 /100 | #187 | Fair 13.7% |
| Immigrants | Eritrea | 32.7 /100 | #188 | Fair 13.7% |
| Finns | 32.5 /100 | #189 | Fair 13.7% |
| Dutch | 29.7 /100 | #190 | Fair 13.8% |
| Immigrants | St. Vincent and the Grenadines | 29.3 /100 | #191 | Fair 13.8% |
| Tlingit-Haida | 28.1 /100 | #192 | Fair 13.8% |