Dutch vs Immigrants from Hong Kong Single Mother Poverty
COMPARE
Dutch
Immigrants from Hong Kong
Single Mother Poverty
Single Mother Poverty Comparison
Dutch
Immigrants from Hong Kong
30.2%
SINGLE MOTHER POVERTY
4.3/ 100
METRIC RATING
231st/ 347
METRIC RANK
24.4%
SINGLE MOTHER POVERTY
100.0/ 100
METRIC RATING
5th/ 347
METRIC RANK
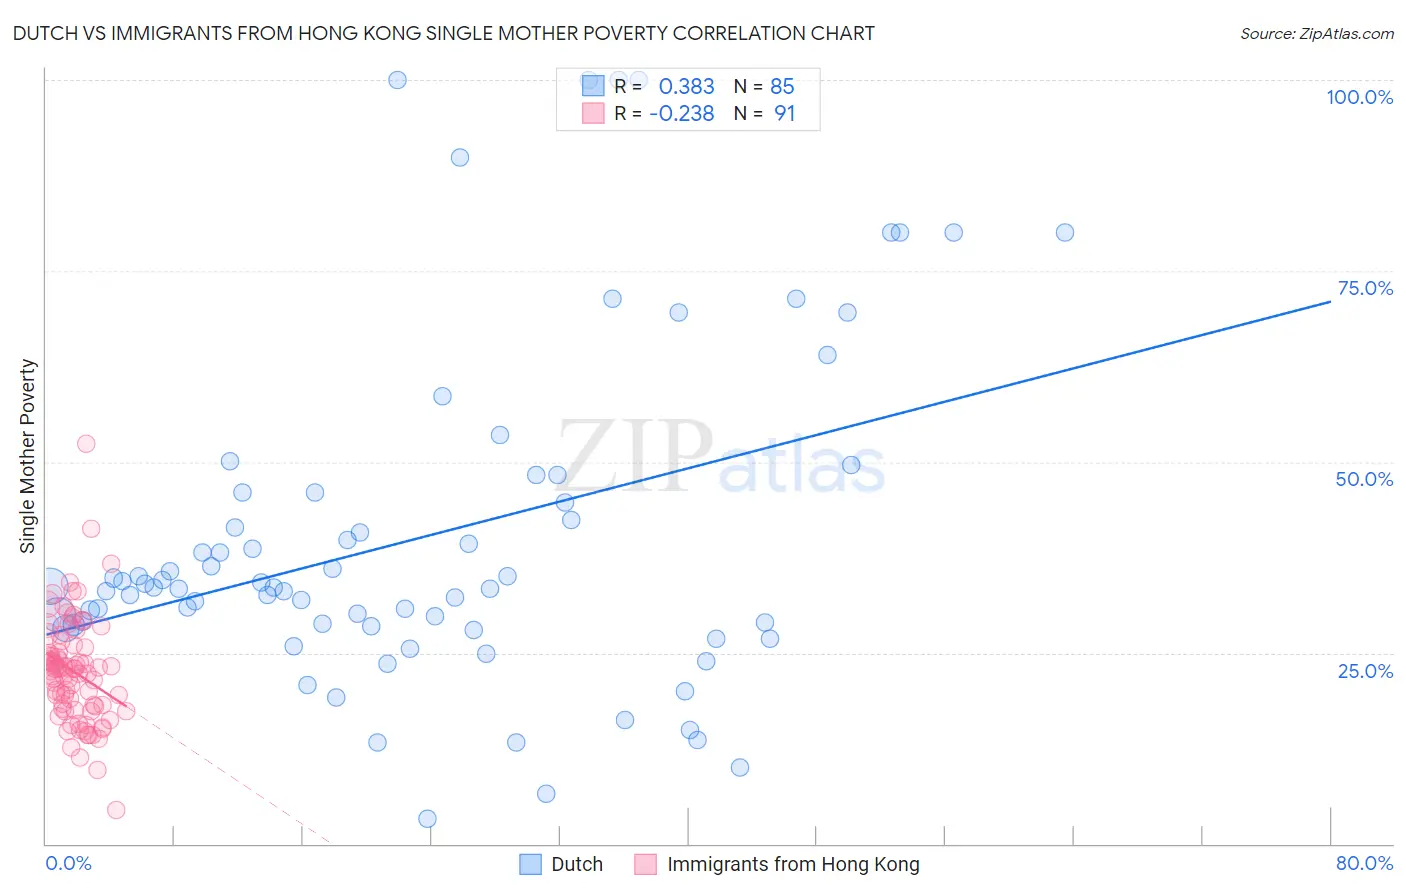
Dutch vs Immigrants from Hong Kong Single Mother Poverty Correlation Chart
The statistical analysis conducted on geographies consisting of 528,669,117 people shows a mild positive correlation between the proportion of Dutch and poverty level among single mothers in the United States with a correlation coefficient (R) of 0.383 and weighted average of 30.2%. Similarly, the statistical analysis conducted on geographies consisting of 248,457,353 people shows a weak negative correlation between the proportion of Immigrants from Hong Kong and poverty level among single mothers in the United States with a correlation coefficient (R) of -0.238 and weighted average of 24.4%, a difference of 24.1%.
Single Mother Poverty Correlation Summary
| Measurement | Dutch | Immigrants from Hong Kong |
| Minimum | 3.2% | 4.5% |
| Maximum | 100.0% | 52.3% |
| Range | 96.8% | 47.8% |
| Mean | 40.1% | 22.5% |
| Median | 33.5% | 22.9% |
| Interquartile 25% (IQ1) | 28.6% | 17.7% |
| Interquartile 75% (IQ3) | 46.0% | 25.6% |
| Interquartile Range (IQR) | 17.4% | 7.9% |
| Standard Deviation (Sample) | 21.9% | 7.0% |
| Standard Deviation (Population) | 21.8% | 6.9% |
Similar Demographics by Single Mother Poverty
Demographics Similar to Dutch by Single Mother Poverty
In terms of single mother poverty, the demographic groups most similar to Dutch are Alaskan Athabascan (30.3%, a difference of 0.040%), English (30.2%, a difference of 0.15%), Immigrants from Barbados (30.2%, a difference of 0.19%), Immigrants from Middle Africa (30.3%, a difference of 0.25%), and Immigrants from Nicaragua (30.3%, a difference of 0.25%).
| Demographics | Rating | Rank | Single Mother Poverty |
| Immigrants | Sudan | 6.5 /100 | #224 | Tragic 30.1% |
| Spanish | 6.3 /100 | #225 | Tragic 30.1% |
| Scottish | 6.0 /100 | #226 | Tragic 30.1% |
| Immigrants | Liberia | 5.9 /100 | #227 | Tragic 30.1% |
| Spaniards | 5.4 /100 | #228 | Tragic 30.2% |
| Immigrants | Barbados | 5.0 /100 | #229 | Tragic 30.2% |
| English | 4.8 /100 | #230 | Tragic 30.2% |
| Dutch | 4.3 /100 | #231 | Tragic 30.2% |
| Alaskan Athabascans | 4.1 /100 | #232 | Tragic 30.3% |
| Immigrants | Middle Africa | 3.5 /100 | #233 | Tragic 30.3% |
| Immigrants | Nicaragua | 3.5 /100 | #234 | Tragic 30.3% |
| Immigrants | Grenada | 3.4 /100 | #235 | Tragic 30.3% |
| Welsh | 3.2 /100 | #236 | Tragic 30.4% |
| Immigrants | St. Vincent and the Grenadines | 3.1 /100 | #237 | Tragic 30.4% |
| Slovaks | 2.8 /100 | #238 | Tragic 30.4% |
Demographics Similar to Immigrants from Hong Kong by Single Mother Poverty
In terms of single mother poverty, the demographic groups most similar to Immigrants from Hong Kong are Filipino (24.3%, a difference of 0.23%), Thai (24.5%, a difference of 0.49%), Chinese (24.6%, a difference of 1.0%), Immigrants from Taiwan (23.9%, a difference of 2.1%), and Immigrants from India (23.8%, a difference of 2.4%).
| Demographics | Rating | Rank | Single Mother Poverty |
| Assyrians/Chaldeans/Syriacs | 100.0 /100 | #1 | Exceptional 23.8% |
| Immigrants | India | 100.0 /100 | #2 | Exceptional 23.8% |
| Immigrants | Taiwan | 100.0 /100 | #3 | Exceptional 23.9% |
| Filipinos | 100.0 /100 | #4 | Exceptional 24.3% |
| Immigrants | Hong Kong | 100.0 /100 | #5 | Exceptional 24.4% |
| Thais | 100.0 /100 | #6 | Exceptional 24.5% |
| Chinese | 100.0 /100 | #7 | Exceptional 24.6% |
| Immigrants | Iran | 100.0 /100 | #8 | Exceptional 25.1% |
| Immigrants | Lithuania | 100.0 /100 | #9 | Exceptional 25.2% |
| Immigrants | South Central Asia | 100.0 /100 | #10 | Exceptional 25.3% |
| Iranians | 100.0 /100 | #11 | Exceptional 25.5% |
| Bhutanese | 100.0 /100 | #12 | Exceptional 25.6% |
| Indians (Asian) | 100.0 /100 | #13 | Exceptional 25.8% |
| Immigrants | Singapore | 100.0 /100 | #14 | Exceptional 25.8% |
| Immigrants | Ireland | 100.0 /100 | #15 | Exceptional 25.8% |