Dominican vs Soviet Union Female Poverty Among 18-24 Year Olds
COMPARE
Dominican
Soviet Union
Female Poverty Among 18-24 Year Olds
Female Poverty Among 18-24 Year Olds Comparison
Dominicans
Soviet Union
22.3%
FEMALE POVERTY AMONG 18-24 YEAR OLDS
0.0/ 100
METRIC RATING
288th/ 347
METRIC RANK
19.5%
FEMALE POVERTY AMONG 18-24 YEAR OLDS
92.0/ 100
METRIC RATING
135th/ 347
METRIC RANK
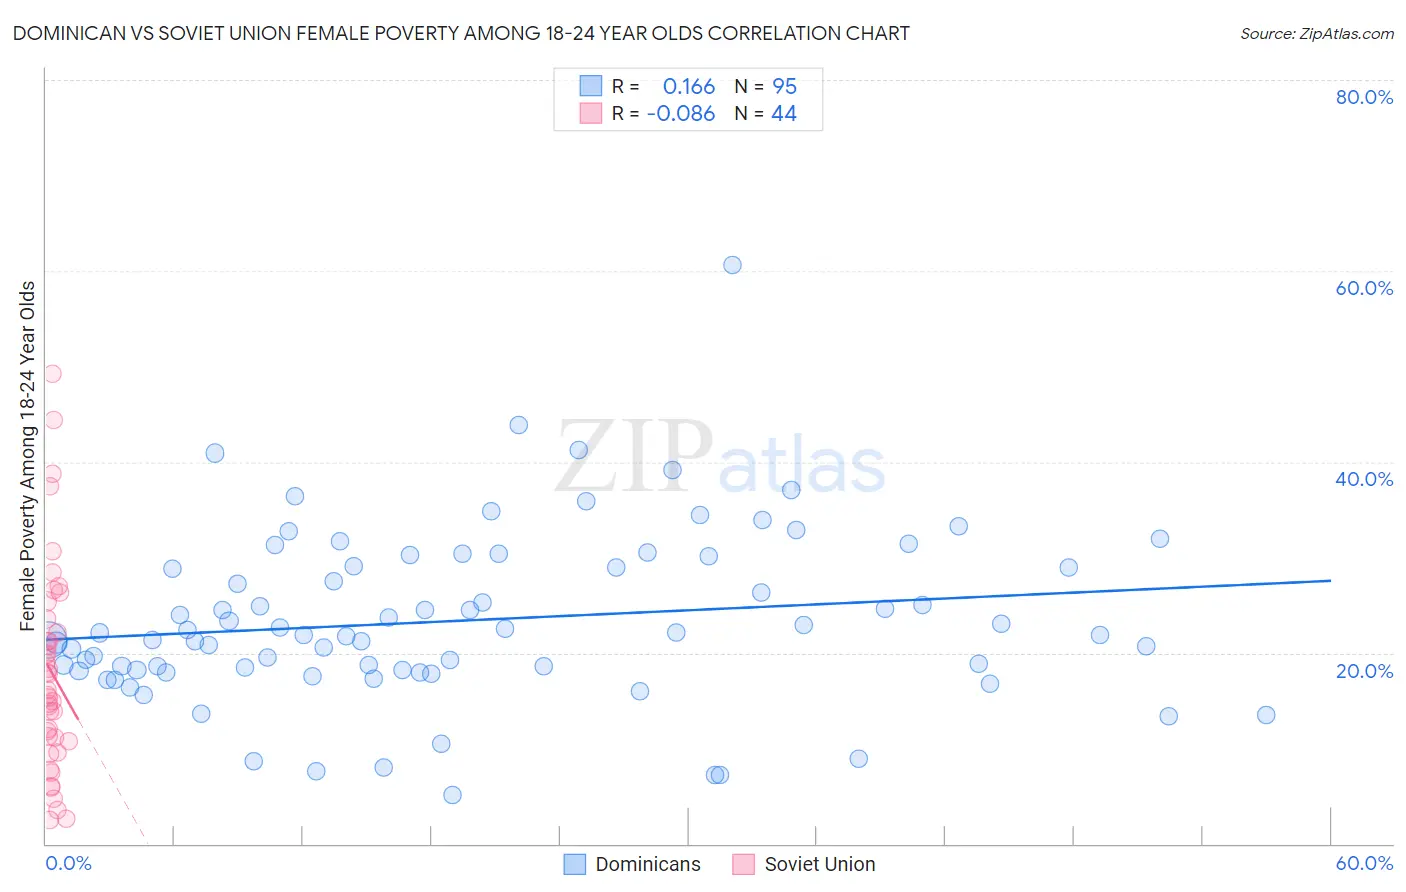
Dominican vs Soviet Union Female Poverty Among 18-24 Year Olds Correlation Chart
The statistical analysis conducted on geographies consisting of 346,732,466 people shows a poor positive correlation between the proportion of Dominicans and poverty level among females between the ages 18 and 24 in the United States with a correlation coefficient (R) of 0.166 and weighted average of 22.3%. Similarly, the statistical analysis conducted on geographies consisting of 43,300,584 people shows a slight negative correlation between the proportion of Soviet Union and poverty level among females between the ages 18 and 24 in the United States with a correlation coefficient (R) of -0.086 and weighted average of 19.5%, a difference of 14.1%.
Female Poverty Among 18-24 Year Olds Correlation Summary
| Measurement | Dominican | Soviet Union |
| Minimum | 5.1% | 2.4% |
| Maximum | 60.6% | 49.3% |
| Range | 55.5% | 46.8% |
| Mean | 23.4% | 18.0% |
| Median | 21.9% | 15.9% |
| Interquartile 25% (IQ1) | 18.1% | 10.9% |
| Interquartile 75% (IQ3) | 29.1% | 22.8% |
| Interquartile Range (IQR) | 11.0% | 11.9% |
| Standard Deviation (Sample) | 9.0% | 10.7% |
| Standard Deviation (Population) | 8.9% | 10.6% |
Similar Demographics by Female Poverty Among 18-24 Year Olds
Demographics Similar to Dominicans by Female Poverty Among 18-24 Year Olds
In terms of female poverty among 18-24 year olds, the demographic groups most similar to Dominicans are French American Indian (22.3%, a difference of 0.070%), Immigrants from Senegal (22.4%, a difference of 0.66%), Immigrants from Middle Africa (22.1%, a difference of 0.75%), Ugandan (22.1%, a difference of 0.77%), and Bangladeshi (22.5%, a difference of 0.93%).
| Demographics | Rating | Rank | Female Poverty Among 18-24 Year Olds |
| Immigrants | Dominican Republic | 0.1 /100 | #281 | Tragic 21.9% |
| Bermudans | 0.1 /100 | #282 | Tragic 21.9% |
| Sub-Saharan Africans | 0.0 /100 | #283 | Tragic 22.0% |
| Tlingit-Haida | 0.0 /100 | #284 | Tragic 22.0% |
| Ottawa | 0.0 /100 | #285 | Tragic 22.0% |
| Ugandans | 0.0 /100 | #286 | Tragic 22.1% |
| Immigrants | Middle Africa | 0.0 /100 | #287 | Tragic 22.1% |
| Dominicans | 0.0 /100 | #288 | Tragic 22.3% |
| French American Indians | 0.0 /100 | #289 | Tragic 22.3% |
| Immigrants | Senegal | 0.0 /100 | #290 | Tragic 22.4% |
| Bangladeshis | 0.0 /100 | #291 | Tragic 22.5% |
| Alaskan Athabascans | 0.0 /100 | #292 | Tragic 22.5% |
| U.S. Virgin Islanders | 0.0 /100 | #293 | Tragic 22.5% |
| Indonesians | 0.0 /100 | #294 | Tragic 22.5% |
| Shoshone | 0.0 /100 | #295 | Tragic 22.5% |
Demographics Similar to Soviet Union by Female Poverty Among 18-24 Year Olds
In terms of female poverty among 18-24 year olds, the demographic groups most similar to Soviet Union are Immigrants from North America (19.5%, a difference of 0.010%), Jamaican (19.5%, a difference of 0.020%), Turkish (19.5%, a difference of 0.020%), Russian (19.5%, a difference of 0.090%), and Latvian (19.5%, a difference of 0.12%).
| Demographics | Rating | Rank | Female Poverty Among 18-24 Year Olds |
| Slovaks | 92.9 /100 | #128 | Exceptional 19.5% |
| Immigrants | England | 92.9 /100 | #129 | Exceptional 19.5% |
| Immigrants | Canada | 92.9 /100 | #130 | Exceptional 19.5% |
| Latvians | 92.7 /100 | #131 | Exceptional 19.5% |
| Jamaicans | 92.1 /100 | #132 | Exceptional 19.5% |
| Turks | 92.1 /100 | #133 | Exceptional 19.5% |
| Immigrants | North America | 92.1 /100 | #134 | Exceptional 19.5% |
| Soviet Union | 92.0 /100 | #135 | Exceptional 19.5% |
| Russians | 91.5 /100 | #136 | Exceptional 19.5% |
| Austrians | 90.7 /100 | #137 | Exceptional 19.5% |
| Immigrants | Morocco | 89.9 /100 | #138 | Excellent 19.6% |
| Indians (Asian) | 88.3 /100 | #139 | Excellent 19.6% |
| Immigrants | Trinidad and Tobago | 85.6 /100 | #140 | Excellent 19.7% |
| Pennsylvania Germans | 85.5 /100 | #141 | Excellent 19.7% |
| Panamanians | 84.6 /100 | #142 | Excellent 19.7% |