Dominican vs Luxembourger Female Poverty
COMPARE
Dominican
Luxembourger
Female Poverty
Female Poverty Comparison
Dominicans
Luxembourgers
19.1%
FEMALE POVERTY
0.0/ 100
METRIC RATING
330th/ 347
METRIC RANK
11.6%
FEMALE POVERTY
99.7/ 100
METRIC RATING
24th/ 347
METRIC RANK
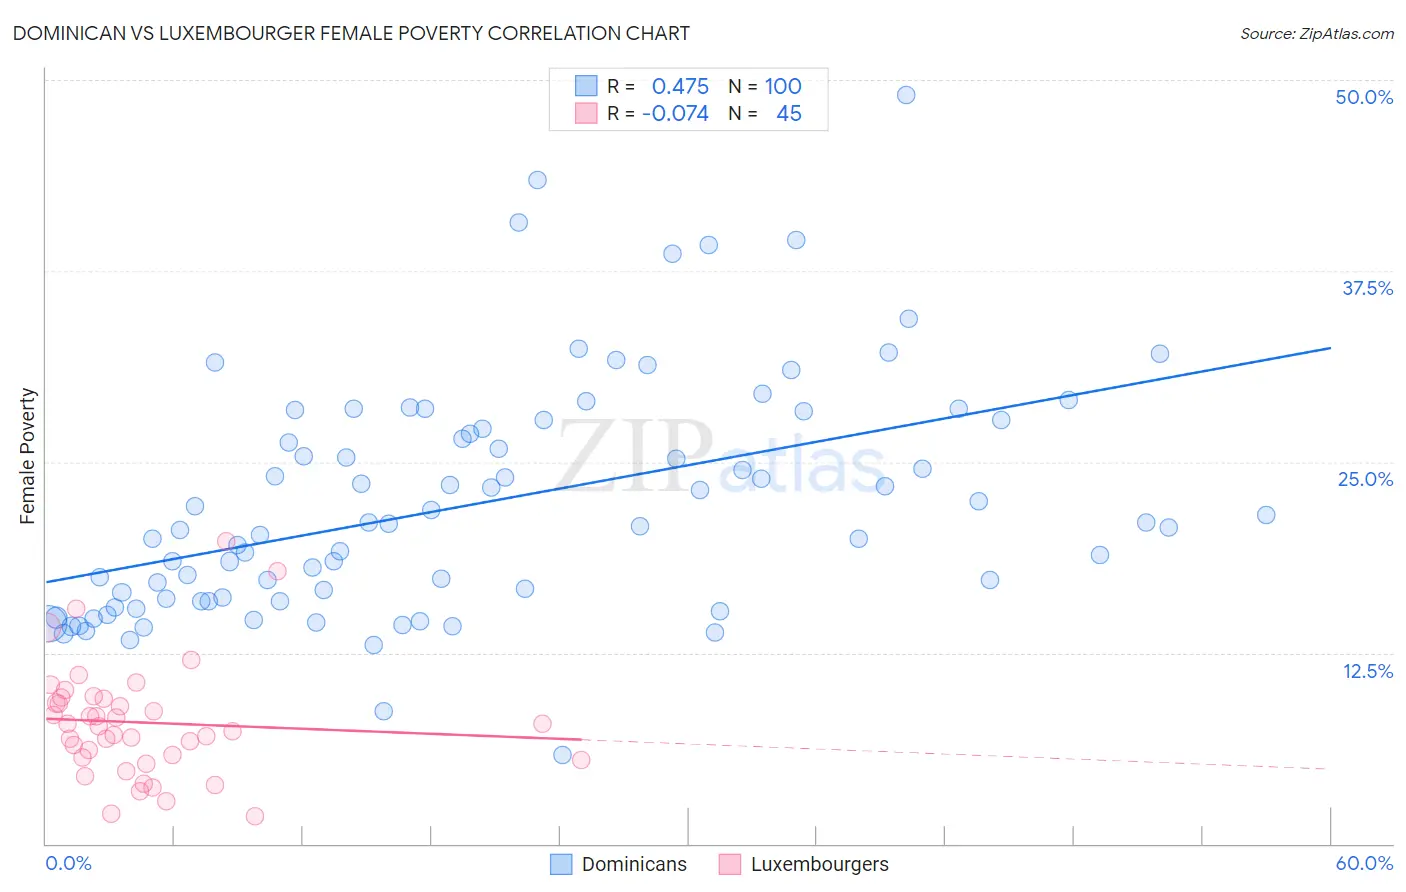
Dominican vs Luxembourger Female Poverty Correlation Chart
The statistical analysis conducted on geographies consisting of 354,675,769 people shows a moderate positive correlation between the proportion of Dominicans and poverty level among females in the United States with a correlation coefficient (R) of 0.475 and weighted average of 19.1%. Similarly, the statistical analysis conducted on geographies consisting of 144,645,818 people shows a slight negative correlation between the proportion of Luxembourgers and poverty level among females in the United States with a correlation coefficient (R) of -0.074 and weighted average of 11.6%, a difference of 64.7%.
Female Poverty Correlation Summary
| Measurement | Dominican | Luxembourger |
| Minimum | 5.8% | 1.8% |
| Maximum | 49.0% | 19.8% |
| Range | 43.2% | 18.1% |
| Mean | 22.3% | 7.9% |
| Median | 20.8% | 7.7% |
| Interquartile 25% (IQ1) | 16.0% | 5.5% |
| Interquartile 75% (IQ3) | 27.4% | 9.5% |
| Interquartile Range (IQR) | 11.5% | 4.0% |
| Standard Deviation (Sample) | 7.8% | 3.8% |
| Standard Deviation (Population) | 7.7% | 3.7% |
Similar Demographics by Female Poverty
Demographics Similar to Dominicans by Female Poverty
In terms of female poverty, the demographic groups most similar to Dominicans are Native/Alaskan (19.2%, a difference of 0.42%), Apache (19.2%, a difference of 0.58%), Immigrants from Dominican Republic (19.3%, a difference of 1.2%), Kiowa (18.6%, a difference of 2.7%), and Black/African American (18.6%, a difference of 2.9%).
| Demographics | Rating | Rank | Female Poverty |
| Paiute | 0.0 /100 | #323 | Tragic 17.7% |
| Immigrants | Honduras | 0.0 /100 | #324 | Tragic 17.7% |
| Colville | 0.0 /100 | #325 | Tragic 17.8% |
| Central American Indians | 0.0 /100 | #326 | Tragic 18.0% |
| Yakama | 0.0 /100 | #327 | Tragic 18.0% |
| Blacks/African Americans | 0.0 /100 | #328 | Tragic 18.6% |
| Kiowa | 0.0 /100 | #329 | Tragic 18.6% |
| Dominicans | 0.0 /100 | #330 | Tragic 19.1% |
| Natives/Alaskans | 0.0 /100 | #331 | Tragic 19.2% |
| Apache | 0.0 /100 | #332 | Tragic 19.2% |
| Immigrants | Dominican Republic | 0.0 /100 | #333 | Tragic 19.3% |
| Houma | 0.0 /100 | #334 | Tragic 20.0% |
| Cheyenne | 0.0 /100 | #335 | Tragic 20.2% |
| Pueblo | 0.0 /100 | #336 | Tragic 20.7% |
| Yuman | 0.0 /100 | #337 | Tragic 20.8% |
Demographics Similar to Luxembourgers by Female Poverty
In terms of female poverty, the demographic groups most similar to Luxembourgers are Burmese (11.6%, a difference of 0.020%), Swedish (11.6%, a difference of 0.16%), Italian (11.6%, a difference of 0.19%), Immigrants from Northern Europe (11.6%, a difference of 0.26%), and Croatian (11.6%, a difference of 0.27%).
| Demographics | Rating | Rank | Female Poverty |
| Bolivians | 99.8 /100 | #17 | Exceptional 11.5% |
| Immigrants | Scotland | 99.8 /100 | #18 | Exceptional 11.5% |
| Norwegians | 99.8 /100 | #19 | Exceptional 11.5% |
| Eastern Europeans | 99.7 /100 | #20 | Exceptional 11.5% |
| Italians | 99.7 /100 | #21 | Exceptional 11.6% |
| Swedes | 99.7 /100 | #22 | Exceptional 11.6% |
| Burmese | 99.7 /100 | #23 | Exceptional 11.6% |
| Luxembourgers | 99.7 /100 | #24 | Exceptional 11.6% |
| Immigrants | Northern Europe | 99.6 /100 | #25 | Exceptional 11.6% |
| Croatians | 99.6 /100 | #26 | Exceptional 11.6% |
| Iranians | 99.6 /100 | #27 | Exceptional 11.7% |
| Immigrants | Korea | 99.6 /100 | #28 | Exceptional 11.7% |
| Immigrants | North Macedonia | 99.6 /100 | #29 | Exceptional 11.7% |
| Greeks | 99.5 /100 | #30 | Exceptional 11.7% |
| Poles | 99.5 /100 | #31 | Exceptional 11.7% |