Dominican vs Immigrants from Nigeria Male Poverty
COMPARE
Dominican
Immigrants from Nigeria
Male Poverty
Male Poverty Comparison
Dominicans
Immigrants from Nigeria
16.1%
MALE POVERTY
0.0/ 100
METRIC RATING
329th/ 347
METRIC RANK
12.3%
MALE POVERTY
1.6/ 100
METRIC RATING
224th/ 347
METRIC RANK
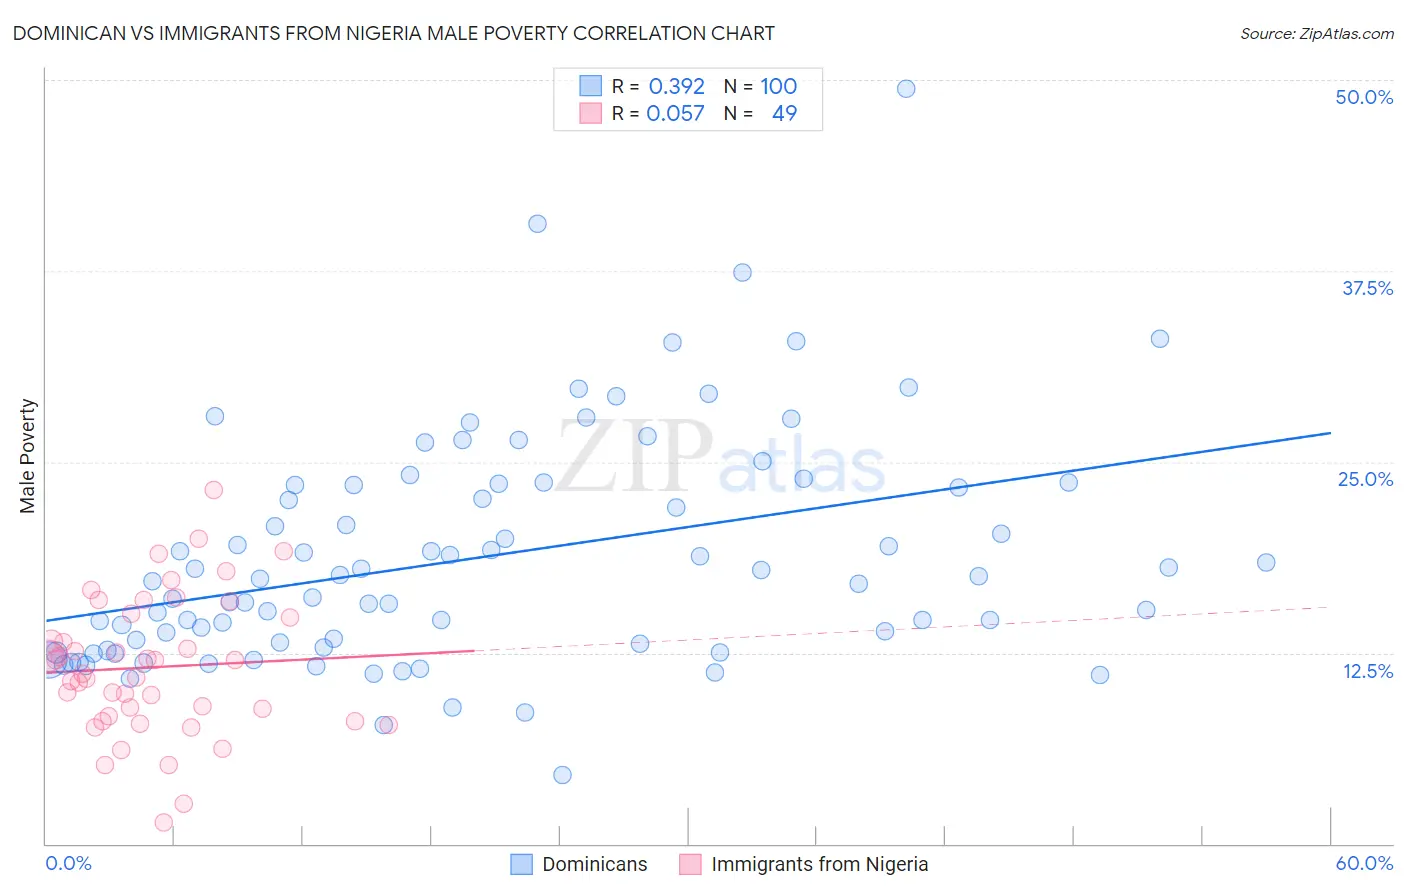
Dominican vs Immigrants from Nigeria Male Poverty Correlation Chart
The statistical analysis conducted on geographies consisting of 354,651,464 people shows a mild positive correlation between the proportion of Dominicans and poverty level among males in the United States with a correlation coefficient (R) of 0.392 and weighted average of 16.1%. Similarly, the statistical analysis conducted on geographies consisting of 283,241,379 people shows a slight positive correlation between the proportion of Immigrants from Nigeria and poverty level among males in the United States with a correlation coefficient (R) of 0.057 and weighted average of 12.3%, a difference of 30.5%.
Male Poverty Correlation Summary
| Measurement | Dominican | Immigrants from Nigeria |
| Minimum | 4.5% | 1.4% |
| Maximum | 49.4% | 23.1% |
| Range | 44.9% | 21.7% |
| Mean | 18.7% | 11.6% |
| Median | 17.2% | 11.1% |
| Interquartile 25% (IQ1) | 13.0% | 8.2% |
| Interquartile 75% (IQ3) | 23.5% | 14.9% |
| Interquartile Range (IQR) | 10.5% | 6.7% |
| Standard Deviation (Sample) | 7.5% | 4.5% |
| Standard Deviation (Population) | 7.5% | 4.5% |
Similar Demographics by Male Poverty
Demographics Similar to Dominicans by Male Poverty
In terms of male poverty, the demographic groups most similar to Dominicans are Immigrants from Dominican Republic (16.2%, a difference of 0.65%), Ute (16.2%, a difference of 0.99%), Black/African American (15.8%, a difference of 1.7%), Paiute (15.8%, a difference of 1.8%), and Houma (16.7%, a difference of 4.0%).
| Demographics | Rating | Rank | Male Poverty |
| Kiowa | 0.0 /100 | #322 | Tragic 15.2% |
| Colville | 0.0 /100 | #323 | Tragic 15.2% |
| Menominee | 0.0 /100 | #324 | Tragic 15.3% |
| Yakama | 0.0 /100 | #325 | Tragic 15.3% |
| Central American Indians | 0.0 /100 | #326 | Tragic 15.3% |
| Paiute | 0.0 /100 | #327 | Tragic 15.8% |
| Blacks/African Americans | 0.0 /100 | #328 | Tragic 15.8% |
| Dominicans | 0.0 /100 | #329 | Tragic 16.1% |
| Immigrants | Dominican Republic | 0.0 /100 | #330 | Tragic 16.2% |
| Ute | 0.0 /100 | #331 | Tragic 16.2% |
| Houma | 0.0 /100 | #332 | Tragic 16.7% |
| Natives/Alaskans | 0.0 /100 | #333 | Tragic 16.9% |
| Cheyenne | 0.0 /100 | #334 | Tragic 17.6% |
| Apache | 0.0 /100 | #335 | Tragic 17.7% |
| Pueblo | 0.0 /100 | #336 | Tragic 18.5% |
Demographics Similar to Immigrants from Nigeria by Male Poverty
In terms of male poverty, the demographic groups most similar to Immigrants from Nigeria are Osage (12.3%, a difference of 0.060%), Nigerian (12.3%, a difference of 0.22%), Alaska Native (12.4%, a difference of 0.32%), Alsatian (12.4%, a difference of 0.36%), and Cuban (12.4%, a difference of 0.45%).
| Demographics | Rating | Rank | Male Poverty |
| Immigrants | Thailand | 2.5 /100 | #217 | Tragic 12.2% |
| German Russians | 2.5 /100 | #218 | Tragic 12.2% |
| Bermudans | 2.4 /100 | #219 | Tragic 12.2% |
| Immigrants | Eritrea | 2.4 /100 | #220 | Tragic 12.2% |
| Ugandans | 2.2 /100 | #221 | Tragic 12.2% |
| Immigrants | Africa | 2.1 /100 | #222 | Tragic 12.2% |
| Immigrants | Micronesia | 2.1 /100 | #223 | Tragic 12.2% |
| Immigrants | Nigeria | 1.6 /100 | #224 | Tragic 12.3% |
| Osage | 1.5 /100 | #225 | Tragic 12.3% |
| Nigerians | 1.4 /100 | #226 | Tragic 12.3% |
| Alaska Natives | 1.4 /100 | #227 | Tragic 12.4% |
| Alsatians | 1.3 /100 | #228 | Tragic 12.4% |
| Cubans | 1.3 /100 | #229 | Tragic 12.4% |
| Marshallese | 0.8 /100 | #230 | Tragic 12.5% |
| Salvadorans | 0.6 /100 | #231 | Tragic 12.6% |