Dominican vs Immigrants from Dominica Child Poverty Among Girls Under 16
COMPARE
Dominican
Immigrants from Dominica
Child Poverty Among Girls Under 16
Child Poverty Among Girls Under 16 Comparison
Dominicans
Immigrants from Dominica
23.7%
CHILD POVERTY AMONG GIRLS UNDER 16
0.0/ 100
METRIC RATING
328th/ 347
METRIC RANK
22.1%
CHILD POVERTY AMONG GIRLS UNDER 16
0.0/ 100
METRIC RATING
318th/ 347
METRIC RANK
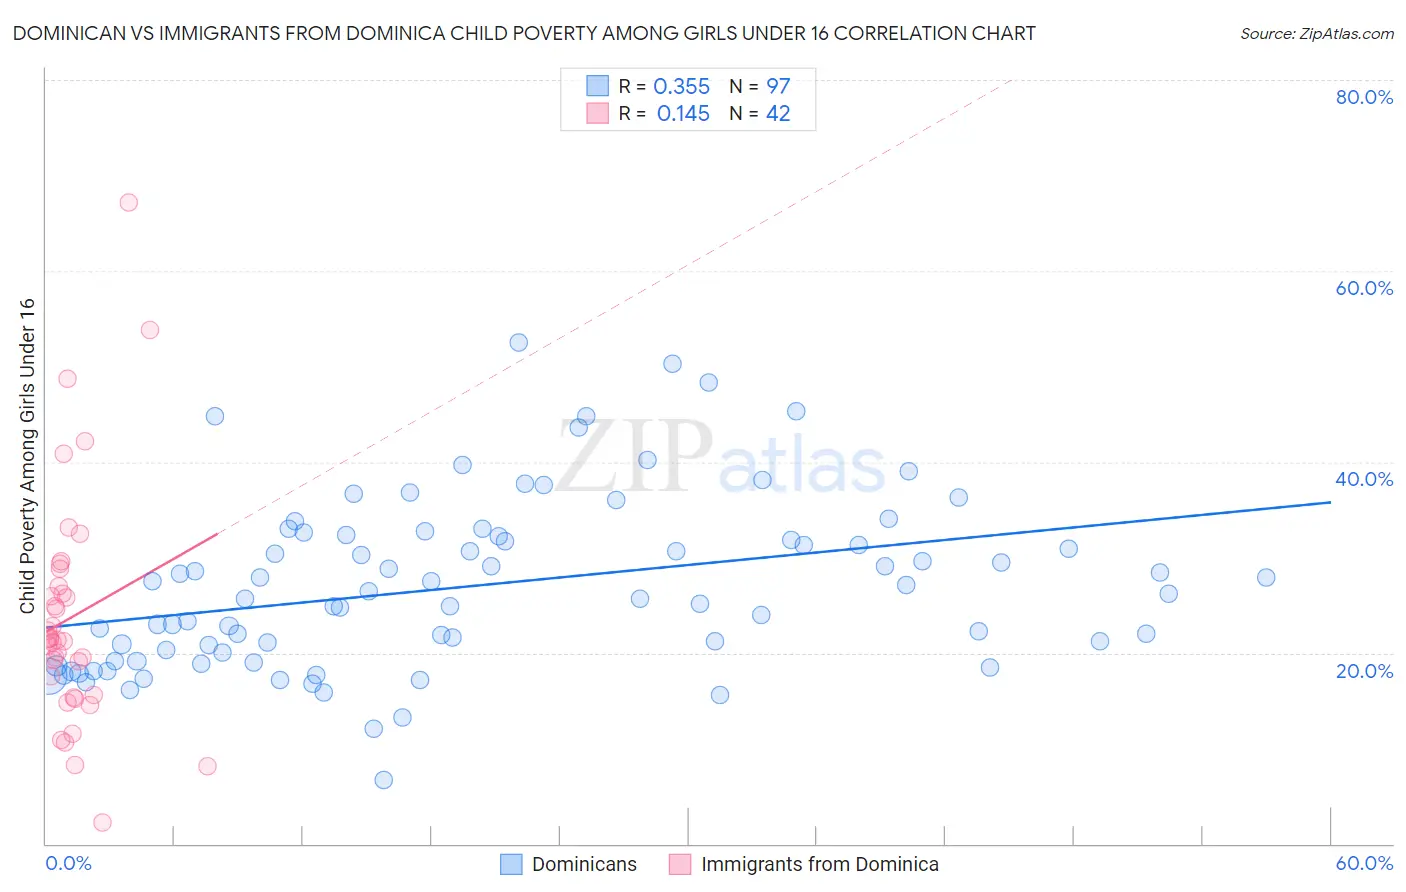
Dominican vs Immigrants from Dominica Child Poverty Among Girls Under 16 Correlation Chart
The statistical analysis conducted on geographies consisting of 349,076,345 people shows a mild positive correlation between the proportion of Dominicans and poverty level among girls under the age of 16 in the United States with a correlation coefficient (R) of 0.355 and weighted average of 23.7%. Similarly, the statistical analysis conducted on geographies consisting of 83,543,005 people shows a poor positive correlation between the proportion of Immigrants from Dominica and poverty level among girls under the age of 16 in the United States with a correlation coefficient (R) of 0.145 and weighted average of 22.1%, a difference of 7.2%.
Child Poverty Among Girls Under 16 Correlation Summary
| Measurement | Dominican | Immigrants from Dominica |
| Minimum | 6.6% | 2.2% |
| Maximum | 52.5% | 67.2% |
| Range | 45.9% | 65.0% |
| Mean | 27.0% | 23.7% |
| Median | 26.2% | 21.4% |
| Interquartile 25% (IQ1) | 19.6% | 15.6% |
| Interquartile 75% (IQ3) | 32.2% | 26.9% |
| Interquartile Range (IQR) | 12.6% | 11.4% |
| Standard Deviation (Sample) | 9.0% | 12.4% |
| Standard Deviation (Population) | 8.9% | 12.3% |
Demographics Similar to Dominicans and Immigrants from Dominica by Child Poverty Among Girls Under 16
In terms of child poverty among girls under 16, the demographic groups most similar to Dominicans are Kiowa (23.7%, a difference of 0.12%), Immigrants from Dominican Republic (23.8%, a difference of 0.65%), Apache (23.8%, a difference of 0.70%), Native/Alaskan (24.0%, a difference of 1.6%), and Central American Indian (22.8%, a difference of 3.8%). Similarly, the demographic groups most similar to Immigrants from Dominica are U.S. Virgin Islander (22.1%, a difference of 0.16%), African (21.9%, a difference of 0.66%), Honduran (22.2%, a difference of 0.76%), Immigrants from Guatemala (21.9%, a difference of 0.99%), and Ute (21.8%, a difference of 1.3%).
| Demographics | Rating | Rank | Child Poverty Among Girls Under 16 |
| Creek | 0.0 /100 | #313 | Tragic 21.7% |
| Arapaho | 0.0 /100 | #314 | Tragic 21.7% |
| Ute | 0.0 /100 | #315 | Tragic 21.8% |
| Immigrants | Guatemala | 0.0 /100 | #316 | Tragic 21.9% |
| Africans | 0.0 /100 | #317 | Tragic 21.9% |
| Immigrants | Dominica | 0.0 /100 | #318 | Tragic 22.1% |
| U.S. Virgin Islanders | 0.0 /100 | #319 | Tragic 22.1% |
| Hondurans | 0.0 /100 | #320 | Tragic 22.2% |
| Colville | 0.0 /100 | #321 | Tragic 22.5% |
| Yakama | 0.0 /100 | #322 | Tragic 22.6% |
| Cajuns | 0.0 /100 | #323 | Tragic 22.6% |
| Paiute | 0.0 /100 | #324 | Tragic 22.6% |
| Immigrants | Congo | 0.0 /100 | #325 | Tragic 22.7% |
| Immigrants | Honduras | 0.0 /100 | #326 | Tragic 22.8% |
| Central American Indians | 0.0 /100 | #327 | Tragic 22.8% |
| Dominicans | 0.0 /100 | #328 | Tragic 23.7% |
| Kiowa | 0.0 /100 | #329 | Tragic 23.7% |
| Immigrants | Dominican Republic | 0.0 /100 | #330 | Tragic 23.8% |
| Apache | 0.0 /100 | #331 | Tragic 23.8% |
| Natives/Alaskans | 0.0 /100 | #332 | Tragic 24.0% |
| Blacks/African Americans | 0.0 /100 | #333 | Tragic 24.7% |