Czechoslovakian vs Peruvian Seniors Poverty Over the Age of 75
COMPARE
Czechoslovakian
Peruvian
Seniors Poverty Over the Age of 75
Seniors Poverty Over the Age of 75 Comparison
Czechoslovakians
Peruvians
10.9%
SENIORS POVERTY OVER THE AGE OF 75
99.4/ 100
METRIC RATING
39th/ 347
METRIC RANK
13.4%
SENIORS POVERTY OVER THE AGE OF 75
0.8/ 100
METRIC RATING
238th/ 347
METRIC RANK
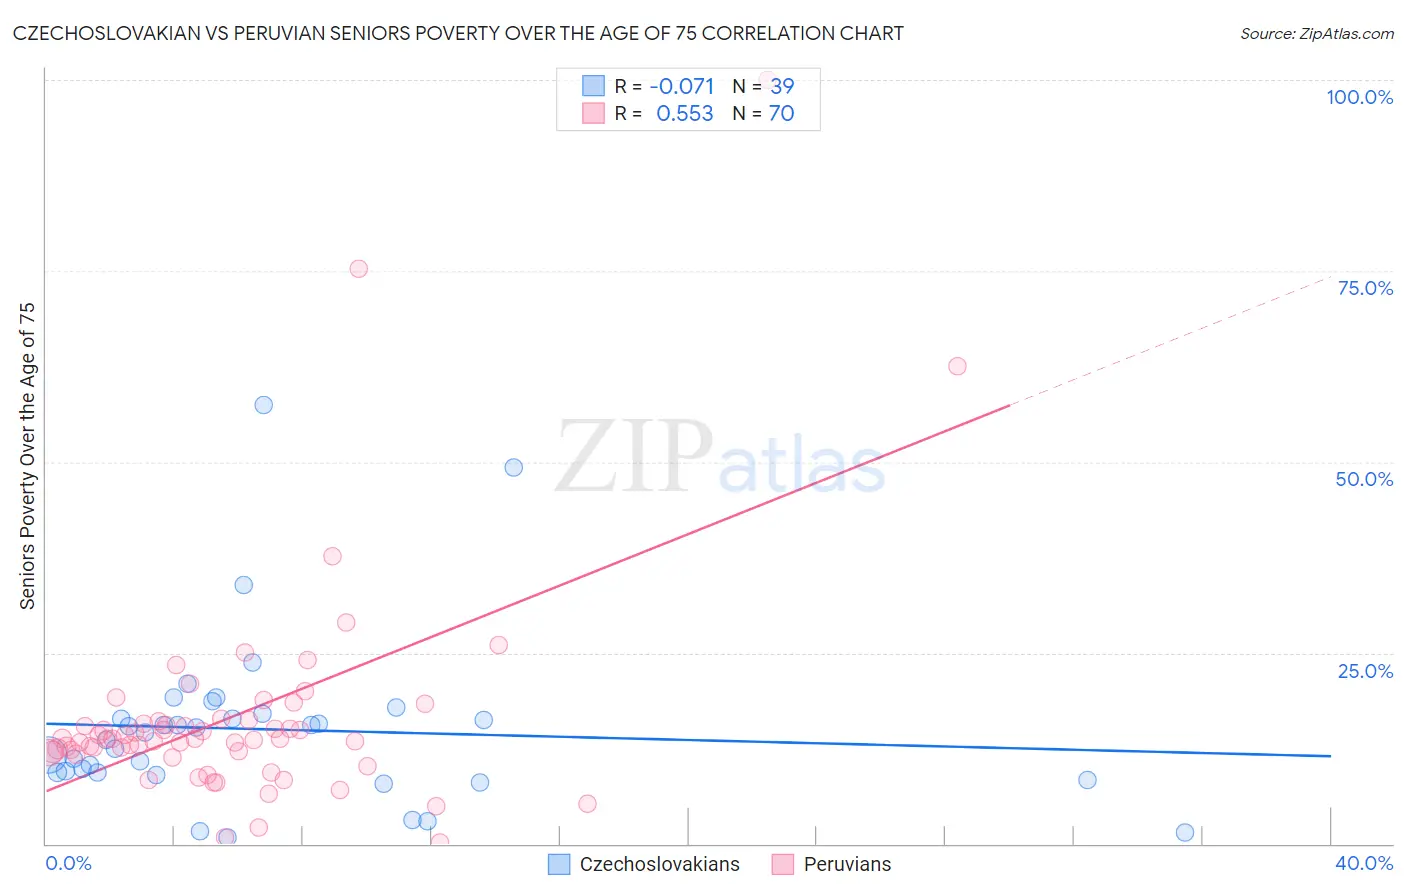
Czechoslovakian vs Peruvian Seniors Poverty Over the Age of 75 Correlation Chart
The statistical analysis conducted on geographies consisting of 364,126,572 people shows a slight negative correlation between the proportion of Czechoslovakians and poverty level among seniors over the age of 75 in the United States with a correlation coefficient (R) of -0.071 and weighted average of 10.9%. Similarly, the statistical analysis conducted on geographies consisting of 359,440,358 people shows a substantial positive correlation between the proportion of Peruvians and poverty level among seniors over the age of 75 in the United States with a correlation coefficient (R) of 0.553 and weighted average of 13.4%, a difference of 22.6%.
Seniors Poverty Over the Age of 75 Correlation Summary
| Measurement | Czechoslovakian | Peruvian |
| Minimum | 0.75% | 0.17% |
| Maximum | 57.4% | 100.0% |
| Range | 56.6% | 99.8% |
| Mean | 15.0% | 16.7% |
| Median | 14.5% | 13.7% |
| Interquartile 25% (IQ1) | 9.4% | 11.9% |
| Interquartile 75% (IQ3) | 16.9% | 16.0% |
| Interquartile Range (IQR) | 7.6% | 4.1% |
| Standard Deviation (Sample) | 11.2% | 15.0% |
| Standard Deviation (Population) | 11.0% | 14.9% |
Similar Demographics by Seniors Poverty Over the Age of 75
Demographics Similar to Czechoslovakians by Seniors Poverty Over the Age of 75
In terms of seniors poverty over the age of 75, the demographic groups most similar to Czechoslovakians are Thai (10.9%, a difference of 0.22%), Finnish (10.8%, a difference of 0.62%), Immigrants from Lithuania (11.0%, a difference of 0.71%), Latvian (10.8%, a difference of 0.76%), and Scotch-Irish (10.8%, a difference of 0.93%).
| Demographics | Rating | Rank | Seniors Poverty Over the Age of 75 |
| British | 99.7 /100 | #32 | Exceptional 10.7% |
| Puget Sound Salish | 99.7 /100 | #33 | Exceptional 10.8% |
| Italians | 99.7 /100 | #34 | Exceptional 10.8% |
| Luxembourgers | 99.6 /100 | #35 | Exceptional 10.8% |
| Scotch-Irish | 99.6 /100 | #36 | Exceptional 10.8% |
| Latvians | 99.6 /100 | #37 | Exceptional 10.8% |
| Finns | 99.6 /100 | #38 | Exceptional 10.8% |
| Czechoslovakians | 99.4 /100 | #39 | Exceptional 10.9% |
| Thais | 99.4 /100 | #40 | Exceptional 10.9% |
| Immigrants | Lithuania | 99.2 /100 | #41 | Exceptional 11.0% |
| Austrians | 99.1 /100 | #42 | Exceptional 11.0% |
| Celtics | 99.1 /100 | #43 | Exceptional 11.0% |
| Belgians | 99.1 /100 | #44 | Exceptional 11.0% |
| Carpatho Rusyns | 99.0 /100 | #45 | Exceptional 11.1% |
| Greeks | 99.0 /100 | #46 | Exceptional 11.1% |
Demographics Similar to Peruvians by Seniors Poverty Over the Age of 75
In terms of seniors poverty over the age of 75, the demographic groups most similar to Peruvians are Alaskan Athabascan (13.4%, a difference of 0.020%), Panamanian (13.4%, a difference of 0.10%), Moroccan (13.3%, a difference of 0.20%), Japanese (13.3%, a difference of 0.21%), and Argentinean (13.4%, a difference of 0.41%).
| Demographics | Rating | Rank | Seniors Poverty Over the Age of 75 |
| Sub-Saharan Africans | 1.5 /100 | #231 | Tragic 13.2% |
| Immigrants | Chile | 1.3 /100 | #232 | Tragic 13.3% |
| Immigrants | Costa Rica | 1.3 /100 | #233 | Tragic 13.3% |
| Immigrants | Israel | 1.1 /100 | #234 | Tragic 13.3% |
| Japanese | 0.9 /100 | #235 | Tragic 13.3% |
| Moroccans | 0.9 /100 | #236 | Tragic 13.3% |
| Alaskan Athabascans | 0.8 /100 | #237 | Tragic 13.4% |
| Peruvians | 0.8 /100 | #238 | Tragic 13.4% |
| Panamanians | 0.8 /100 | #239 | Tragic 13.4% |
| Argentineans | 0.7 /100 | #240 | Tragic 13.4% |
| Immigrants | Russia | 0.6 /100 | #241 | Tragic 13.4% |
| Immigrants | Somalia | 0.6 /100 | #242 | Tragic 13.5% |
| Dutch West Indians | 0.6 /100 | #243 | Tragic 13.5% |
| Spanish Americans | 0.5 /100 | #244 | Tragic 13.5% |
| Uruguayans | 0.5 /100 | #245 | Tragic 13.5% |