Czechoslovakian vs Immigrants from Ireland Female Poverty Among 18-24 Year Olds
COMPARE
Czechoslovakian
Immigrants from Ireland
Female Poverty Among 18-24 Year Olds
Female Poverty Among 18-24 Year Olds Comparison
Czechoslovakians
Immigrants from Ireland
20.0%
FEMALE POVERTY AMONG 18-24 YEAR OLDS
61.8/ 100
METRIC RATING
167th/ 347
METRIC RANK
18.3%
FEMALE POVERTY AMONG 18-24 YEAR OLDS
99.9/ 100
METRIC RATING
52nd/ 347
METRIC RANK
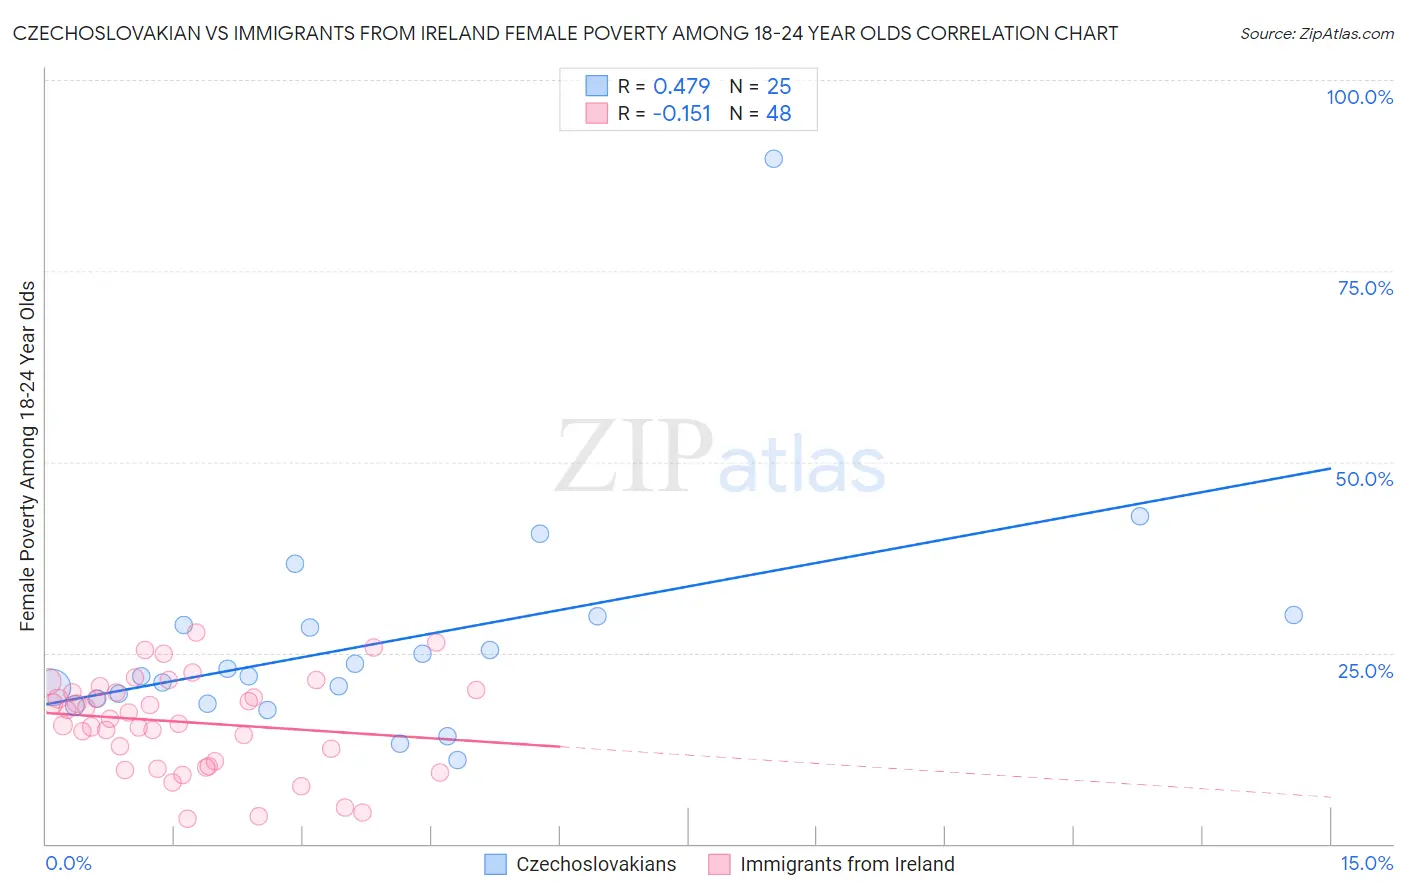
Czechoslovakian vs Immigrants from Ireland Female Poverty Among 18-24 Year Olds Correlation Chart
The statistical analysis conducted on geographies consisting of 357,520,736 people shows a moderate positive correlation between the proportion of Czechoslovakians and poverty level among females between the ages 18 and 24 in the United States with a correlation coefficient (R) of 0.479 and weighted average of 20.0%. Similarly, the statistical analysis conducted on geographies consisting of 234,757,176 people shows a poor negative correlation between the proportion of Immigrants from Ireland and poverty level among females between the ages 18 and 24 in the United States with a correlation coefficient (R) of -0.151 and weighted average of 18.3%, a difference of 9.1%.
Female Poverty Among 18-24 Year Olds Correlation Summary
| Measurement | Czechoslovakian | Immigrants from Ireland |
| Minimum | 11.0% | 3.3% |
| Maximum | 89.7% | 27.7% |
| Range | 78.7% | 24.4% |
| Mean | 26.4% | 15.9% |
| Median | 22.0% | 16.8% |
| Interquartile 25% (IQ1) | 18.6% | 10.5% |
| Interquartile 75% (IQ3) | 29.3% | 20.0% |
| Interquartile Range (IQR) | 10.6% | 9.4% |
| Standard Deviation (Sample) | 15.4% | 6.2% |
| Standard Deviation (Population) | 15.1% | 6.1% |
Similar Demographics by Female Poverty Among 18-24 Year Olds
Demographics Similar to Czechoslovakians by Female Poverty Among 18-24 Year Olds
In terms of female poverty among 18-24 year olds, the demographic groups most similar to Czechoslovakians are Fijian (20.0%, a difference of 0.14%), Hmong (20.0%, a difference of 0.32%), Iranian (20.1%, a difference of 0.36%), Immigrants from Nigeria (20.1%, a difference of 0.38%), and Belgian (19.9%, a difference of 0.40%).
| Demographics | Rating | Rank | Female Poverty Among 18-24 Year Olds |
| Pakistanis | 74.1 /100 | #160 | Good 19.8% |
| Immigrants | Belize | 74.1 /100 | #161 | Good 19.8% |
| French Canadians | 73.0 /100 | #162 | Good 19.9% |
| Malaysians | 72.7 /100 | #163 | Good 19.9% |
| Central Americans | 70.0 /100 | #164 | Good 19.9% |
| Eastern Europeans | 69.3 /100 | #165 | Good 19.9% |
| Belgians | 69.1 /100 | #166 | Good 19.9% |
| Czechoslovakians | 61.8 /100 | #167 | Good 20.0% |
| Fijians | 59.1 /100 | #168 | Average 20.0% |
| Hmong | 55.4 /100 | #169 | Average 20.0% |
| Iranians | 54.7 /100 | #170 | Average 20.1% |
| Immigrants | Nigeria | 54.3 /100 | #171 | Average 20.1% |
| Belizeans | 52.0 /100 | #172 | Average 20.1% |
| Irish | 50.0 /100 | #173 | Average 20.1% |
| Swedes | 50.0 /100 | #174 | Average 20.1% |
Demographics Similar to Immigrants from Ireland by Female Poverty Among 18-24 Year Olds
In terms of female poverty among 18-24 year olds, the demographic groups most similar to Immigrants from Ireland are Italian (18.3%, a difference of 0.090%), Immigrants from Egypt (18.4%, a difference of 0.32%), Albanian (18.4%, a difference of 0.32%), Argentinean (18.4%, a difference of 0.34%), and Immigrants from Eastern Europe (18.2%, a difference of 0.35%).
| Demographics | Rating | Rank | Female Poverty Among 18-24 Year Olds |
| Spanish American Indians | 100.0 /100 | #45 | Exceptional 18.1% |
| Immigrants | Southern Europe | 100.0 /100 | #46 | Exceptional 18.2% |
| Asians | 100.0 /100 | #47 | Exceptional 18.2% |
| Sri Lankans | 100.0 /100 | #48 | Exceptional 18.2% |
| Bhutanese | 100.0 /100 | #49 | Exceptional 18.2% |
| Samoans | 100.0 /100 | #50 | Exceptional 18.2% |
| Immigrants | Eastern Europe | 99.9 /100 | #51 | Exceptional 18.2% |
| Immigrants | Ireland | 99.9 /100 | #52 | Exceptional 18.3% |
| Italians | 99.9 /100 | #53 | Exceptional 18.3% |
| Immigrants | Egypt | 99.9 /100 | #54 | Exceptional 18.4% |
| Albanians | 99.9 /100 | #55 | Exceptional 18.4% |
| Argentineans | 99.9 /100 | #56 | Exceptional 18.4% |
| Immigrants | Italy | 99.9 /100 | #57 | Exceptional 18.4% |
| Immigrants | Ukraine | 99.9 /100 | #58 | Exceptional 18.4% |
| Egyptians | 99.9 /100 | #59 | Exceptional 18.5% |