Cypriot vs Ukrainian Child Poverty Under the Age of 16
COMPARE
Cypriot
Ukrainian
Child Poverty Under the Age of 16
Child Poverty Under the Age of 16 Comparison
Cypriots
Ukrainians
13.0%
CHILD POVERTY UNDER THE AGE OF 16
99.9/ 100
METRIC RATING
18th/ 347
METRIC RANK
14.4%
CHILD POVERTY UNDER THE AGE OF 16
97.5/ 100
METRIC RATING
75th/ 347
METRIC RANK
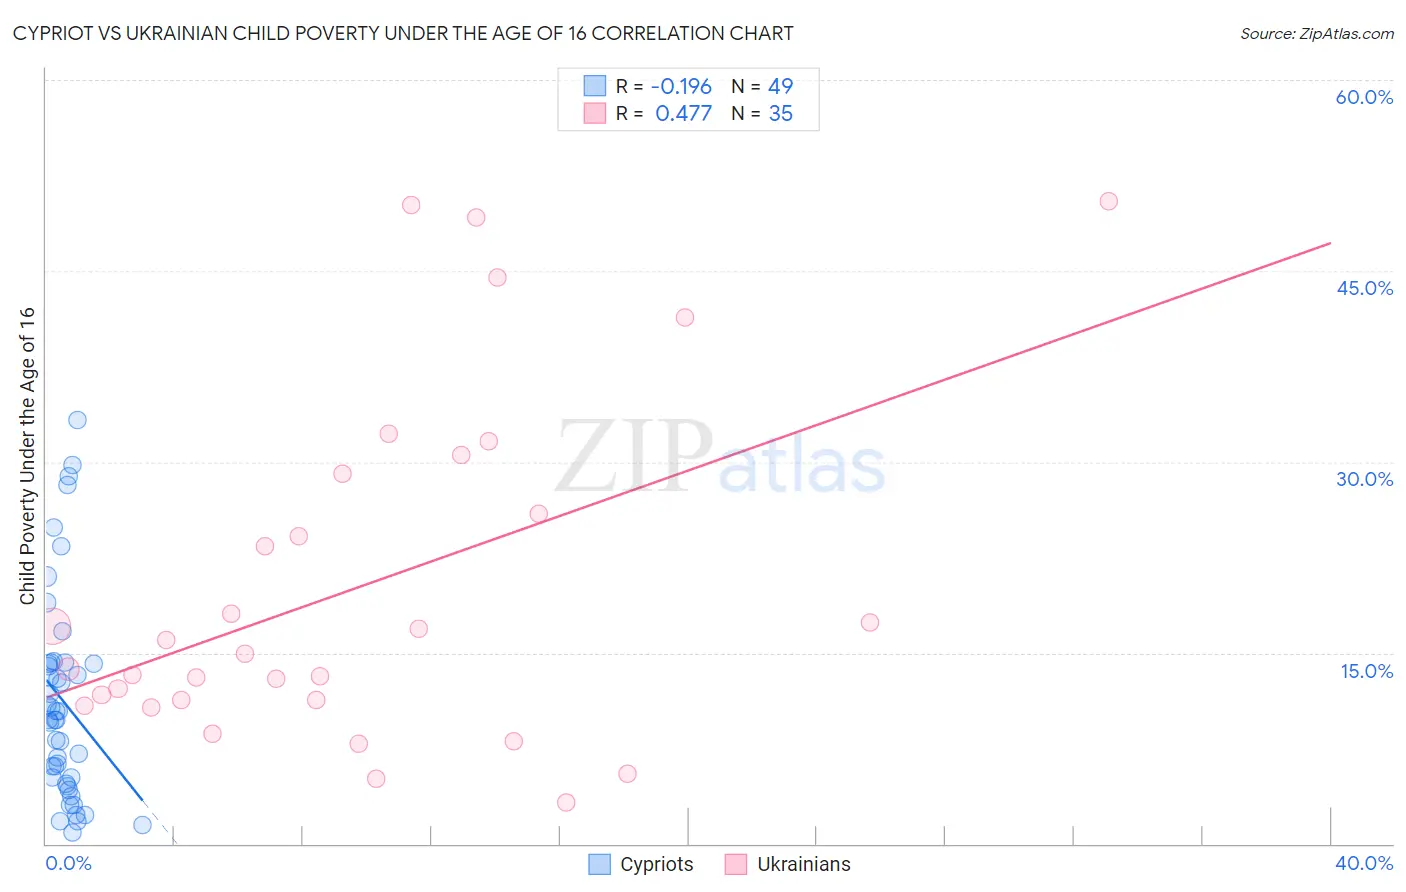
Cypriot vs Ukrainian Child Poverty Under the Age of 16 Correlation Chart
The statistical analysis conducted on geographies consisting of 61,597,688 people shows a poor negative correlation between the proportion of Cypriots and poverty level among children under the age of 16 in the United States with a correlation coefficient (R) of -0.196 and weighted average of 13.0%. Similarly, the statistical analysis conducted on geographies consisting of 441,775,506 people shows a moderate positive correlation between the proportion of Ukrainians and poverty level among children under the age of 16 in the United States with a correlation coefficient (R) of 0.477 and weighted average of 14.4%, a difference of 10.6%.
Child Poverty Under the Age of 16 Correlation Summary
| Measurement | Cypriot | Ukrainian |
| Minimum | 0.90% | 3.2% |
| Maximum | 33.3% | 50.5% |
| Range | 32.4% | 47.2% |
| Mean | 11.2% | 20.2% |
| Median | 9.8% | 14.9% |
| Interquartile 25% (IQ1) | 4.9% | 11.3% |
| Interquartile 75% (IQ3) | 14.2% | 29.0% |
| Interquartile Range (IQR) | 9.3% | 17.8% |
| Standard Deviation (Sample) | 8.0% | 13.5% |
| Standard Deviation (Population) | 8.0% | 13.3% |
Similar Demographics by Child Poverty Under the Age of 16
Demographics Similar to Cypriots by Child Poverty Under the Age of 16
In terms of child poverty under the age of 16, the demographic groups most similar to Cypriots are Immigrants from Japan (13.0%, a difference of 0.030%), Bulgarian (13.0%, a difference of 0.42%), Okinawan (13.1%, a difference of 0.63%), Norwegian (13.0%, a difference of 0.64%), and Immigrants from Eastern Asia (13.1%, a difference of 0.65%).
| Demographics | Rating | Rank | Child Poverty Under the Age of 16 |
| Bhutanese | 99.9 /100 | #11 | Exceptional 12.5% |
| Immigrants | Ireland | 99.9 /100 | #12 | Exceptional 12.7% |
| Burmese | 99.9 /100 | #13 | Exceptional 12.8% |
| Immigrants | Lithuania | 99.9 /100 | #14 | Exceptional 12.9% |
| Immigrants | Korea | 99.9 /100 | #15 | Exceptional 13.0% |
| Norwegians | 99.9 /100 | #16 | Exceptional 13.0% |
| Bulgarians | 99.9 /100 | #17 | Exceptional 13.0% |
| Cypriots | 99.9 /100 | #18 | Exceptional 13.0% |
| Immigrants | Japan | 99.8 /100 | #19 | Exceptional 13.0% |
| Okinawans | 99.8 /100 | #20 | Exceptional 13.1% |
| Immigrants | Eastern Asia | 99.8 /100 | #21 | Exceptional 13.1% |
| Maltese | 99.8 /100 | #22 | Exceptional 13.1% |
| Indians (Asian) | 99.8 /100 | #23 | Exceptional 13.1% |
| Latvians | 99.8 /100 | #24 | Exceptional 13.2% |
| Eastern Europeans | 99.8 /100 | #25 | Exceptional 13.2% |
Demographics Similar to Ukrainians by Child Poverty Under the Age of 16
In terms of child poverty under the age of 16, the demographic groups most similar to Ukrainians are Immigrants from Eastern Europe (14.4%, a difference of 0.0%), Australian (14.4%, a difference of 0.040%), Macedonian (14.4%, a difference of 0.20%), Immigrants from Turkey (14.4%, a difference of 0.21%), and Immigrants from Russia (14.5%, a difference of 0.23%).
| Demographics | Rating | Rank | Child Poverty Under the Age of 16 |
| Laotians | 98.0 /100 | #68 | Exceptional 14.3% |
| Immigrants | Bulgaria | 98.0 /100 | #69 | Exceptional 14.3% |
| Immigrants | Netherlands | 97.9 /100 | #70 | Exceptional 14.3% |
| Immigrants | Poland | 97.9 /100 | #71 | Exceptional 14.3% |
| Cambodians | 97.8 /100 | #72 | Exceptional 14.4% |
| Immigrants | Turkey | 97.6 /100 | #73 | Exceptional 14.4% |
| Macedonians | 97.6 /100 | #74 | Exceptional 14.4% |
| Ukrainians | 97.5 /100 | #75 | Exceptional 14.4% |
| Immigrants | Eastern Europe | 97.5 /100 | #76 | Exceptional 14.4% |
| Australians | 97.5 /100 | #77 | Exceptional 14.4% |
| Immigrants | Russia | 97.3 /100 | #78 | Exceptional 14.5% |
| Swiss | 97.3 /100 | #79 | Exceptional 14.5% |
| Immigrants | North Macedonia | 97.2 /100 | #80 | Exceptional 14.5% |
| Finns | 97.2 /100 | #81 | Exceptional 14.5% |
| Immigrants | Canada | 97.2 /100 | #82 | Exceptional 14.5% |