Cypriot vs Arapaho Child Poverty Among Girls Under 16

COMPARE

Cypriot
Race
Ancestry
AfghanAfricanAlaska NativeAlaskan AthabascanAlbanianAleutAlsatianAmericanApacheArabArgentineanArmenianAssyrian/Chaldean/SyriacAustralianAustrianBahamianBangladeshiBarbadianBasqueBelgianBelizeanBermudanBhutaneseBlackfeetBolivianBrazilianBritishBritish West IndianBulgarianBurmeseCajunCambodianCanadianCape VerdeanCarpatho RusynCelticCentral AmericanCentral American IndianCherokeeCheyenneChickasawChileanChineseChippewaChoctawColombianColvilleComancheCosta RicanCreeCreekCroatianCrowCubanCypriotCzechCzechoslovakianDanishDelawareDominicanDutchDutch West IndianEastern EuropeanEcuadorianEgyptianEnglishEstonianEthiopianEuropeanFijianFilipinoFinnishFrenchFrench American IndianFrench CanadianGermanGerman RussianGhanaianGreekGuamanian/ChamorroGuatemalanGuyaneseHaitianHmongHonduranHopiHoumaHungarianIcelanderIndian (Asian)IndonesianInupiatIranianIraqiIrishIroquoisIsraeliItalianJamaicanJapaneseJordanianKenyanKiowaKoreanLaotianLatvianLebaneseLiberianLithuanianLumbeeLuxembourgerMacedonianMalaysianMalteseMarshalleseMenomineeMexicanMexican American IndianMongolianMoroccanNative HawaiianNavajoNepaleseNew ZealanderNicaraguanNigerianNorthern EuropeanNorwegianOkinawanOsageOttawaPaiutePakistaniPalestinianPanamanianParaguayanPennsylvania GermanPeruvianPimaPolishPortuguesePotawatomiPuebloPuerto RicanPuget Sound SalishRomanianRussianSalvadoranSamoanScandinavianScotch-IrishScottishSeminoleSenegaleseSerbianShoshoneSierra LeoneanSiouxSlavicSlovakSloveneSomaliSouth AfricanSouth AmericanSouth American IndianSoviet UnionSpaniardSpanishSpanish AmericanSpanish American IndianSri LankanSubsaharan AfricanSudaneseSwedishSwissSyrianTaiwaneseThaiTlingit-HaidaTohono O'OdhamTonganTrinidadian and TobagonianTsimshianTurkishU.S. Virgin IslanderUgandanUkrainianUruguayanUteVenezuelanVietnameseWelshWest IndianYakamaYaquiYugoslavianYumanYup'ikZimbabwean
Immigration
NonimmigrantsImmigrantsAfghanistanAfricaAlbaniaArgentinaArmeniaAsiaAustraliaAustriaBahamasBangladeshBarbadosBelarusBelgiumBelizeBoliviaBosnia and HerzegovinaBrazilBulgariaBurma/MyanmarCabo VerdeCambodiaCameroonCanadaCaribbeanCentral AmericaChileChinaColombiaCongoCosta RicaCroatiaCubaCzechoslovakiaDenmarkDominicaDominican RepublicEastern AfricaEastern AsiaEastern EuropeEcuadorEgyptEl SalvadorEnglandEritreaEthiopiaEuropeFijiFranceGermanyGhanaGreeceGrenadaGuatemalaGuyanaHaitiHondurasHong KongHungaryIndiaIndonesiaIranIraqIrelandIsraelItalyJamaicaJapanJordanKazakhstanKenyaKoreaKuwaitLaosLatin AmericaLatviaLebanonLiberiaLithuaniaMalaysiaMexicoMicronesiaMiddle AfricaMoldovaMoroccoNepalNetherlandsNicaraguaNigeriaNorth AmericaNorth MacedoniaNorthern AfricaNorthern EuropeNorwayOceaniaPakistanPanamaPeruPhilippinesPolandPortugalRomaniaRussiaSaudi ArabiaScotlandSenegalSerbiaSierra LeoneSingaporeSomaliaSouth AfricaSouth AmericaSouth Central AsiaSouth Eastern AsiaSouthern EuropeSpainSri LankaSt. Vincent and the GrenadinesSudanSwedenSwitzerlandSyriaTaiwanThailandTrinidad and TobagoTurkeyUgandaUkraineUruguayUzbekistanVenezuelaVietnamWest IndiesWestern AfricaWestern AsiaWestern EuropeYemenZaireZimbabweAzores
Arapaho
Race
Ancestry
AfghanAfricanAlaska NativeAlaskan AthabascanAlbanianAleutAlsatianAmericanApacheArabArapahoArgentineanArmenianAssyrian/Chaldean/SyriacAustralianAustrianBahamianBangladeshiBarbadianBasqueBelgianBelizeanBermudanBhutaneseBlackfeetBolivianBrazilianBritishBritish West IndianBulgarianBurmeseCajunCambodianCanadianCape VerdeanCarpatho RusynCelticCentral AmericanCentral American IndianCherokeeCheyenneChickasawChileanChineseChippewaChoctawColombianColvilleComancheCosta RicanCreeCreekCroatianCrowCubanCzechCzechoslovakianDanishDelawareDominicanDutchDutch West IndianEastern EuropeanEcuadorianEgyptianEnglishEstonianEthiopianEuropeanFijianFilipinoFinnishFrenchFrench American IndianFrench CanadianGermanGerman RussianGhanaianGreekGuamanian/ChamorroGuatemalanGuyaneseHaitianHmongHonduranHopiHoumaHungarianIcelanderIndian (Asian)IndonesianInupiatIranianIraqiIrishIroquoisIsraeliItalianJamaicanJapaneseJordanianKenyanKiowaKoreanLaotianLatvianLebaneseLiberianLithuanianLumbeeLuxembourgerMacedonianMalaysianMalteseMarshalleseMenomineeMexicanMexican American IndianMongolianMoroccanNative HawaiianNavajoNepaleseNew ZealanderNicaraguanNigerianNorthern EuropeanNorwegianOkinawanOsageOttawaPaiutePakistaniPalestinianPanamanianParaguayanPennsylvania GermanPeruvianPimaPolishPortuguesePotawatomiPuebloPuerto RicanPuget Sound SalishRomanianRussianSalvadoranSamoanScandinavianScotch-IrishScottishSeminoleSenegaleseSerbianShoshoneSierra LeoneanSiouxSlavicSlovakSloveneSomaliSouth AfricanSouth AmericanSouth American IndianSoviet UnionSpaniardSpanishSpanish AmericanSpanish American IndianSri LankanSubsaharan AfricanSudaneseSwedishSwissSyrianTaiwaneseThaiTlingit-HaidaTohono O'OdhamTonganTrinidadian and TobagonianTsimshianTurkishU.S. Virgin IslanderUgandanUkrainianUruguayanUteVenezuelanVietnameseWelshWest IndianYakamaYaquiYugoslavianYumanYup'ikZimbabwean
Immigration
NonimmigrantsImmigrantsAfghanistanAfricaAlbaniaArgentinaArmeniaAsiaAustraliaAustriaBahamasBangladeshBarbadosBelarusBelgiumBelizeBoliviaBosnia and HerzegovinaBrazilBulgariaBurma/MyanmarCabo VerdeCambodiaCameroonCanadaCaribbeanCentral AmericaChileChinaColombiaCongoCosta RicaCroatiaCubaCzechoslovakiaDenmarkDominicaDominican RepublicEastern AfricaEastern AsiaEastern EuropeEcuadorEgyptEl SalvadorEnglandEritreaEthiopiaEuropeFijiFranceGermanyGhanaGreeceGrenadaGuatemalaGuyanaHaitiHondurasHong KongHungaryIndiaIndonesiaIranIraqIrelandIsraelItalyJamaicaJapanJordanKazakhstanKenyaKoreaKuwaitLaosLatin AmericaLatviaLebanonLiberiaLithuaniaMalaysiaMexicoMicronesiaMiddle AfricaMoldovaMoroccoNepalNetherlandsNicaraguaNigeriaNorth AmericaNorth MacedoniaNorthern AfricaNorthern EuropeNorwayOceaniaPakistanPanamaPeruPhilippinesPolandPortugalRomaniaRussiaSaudi ArabiaScotlandSenegalSerbiaSierra LeoneSingaporeSomaliaSouth AfricaSouth AmericaSouth Central AsiaSouth Eastern AsiaSouthern EuropeSpainSri LankaSt. Vincent and the GrenadinesSudanSwedenSwitzerlandSyriaTaiwanThailandTrinidad and TobagoTurkeyUgandaUkraineUruguayUzbekistanVenezuelaVietnamWest IndiesWestern AfricaWestern AsiaWestern EuropeYemenZaireZimbabweAzores
Child Poverty Among Girls Under 16
Income
Poverty
Unemployment
Labor Participation
Family Structure
Vehicle Availability
Education Level
Disability

Child Poverty Among Girls Under 16 Comparison

Cypriots

Arapaho

Exceptional
Tragic
13.2%
CHILD POVERTY AMONG GIRLS UNDER 16
99.9/ 100
METRIC RATING
19th/ 347
METRIC RANK
21.7%
CHILD POVERTY AMONG GIRLS UNDER 16
0.0/ 100
METRIC RATING
314th/ 347
METRIC RANK

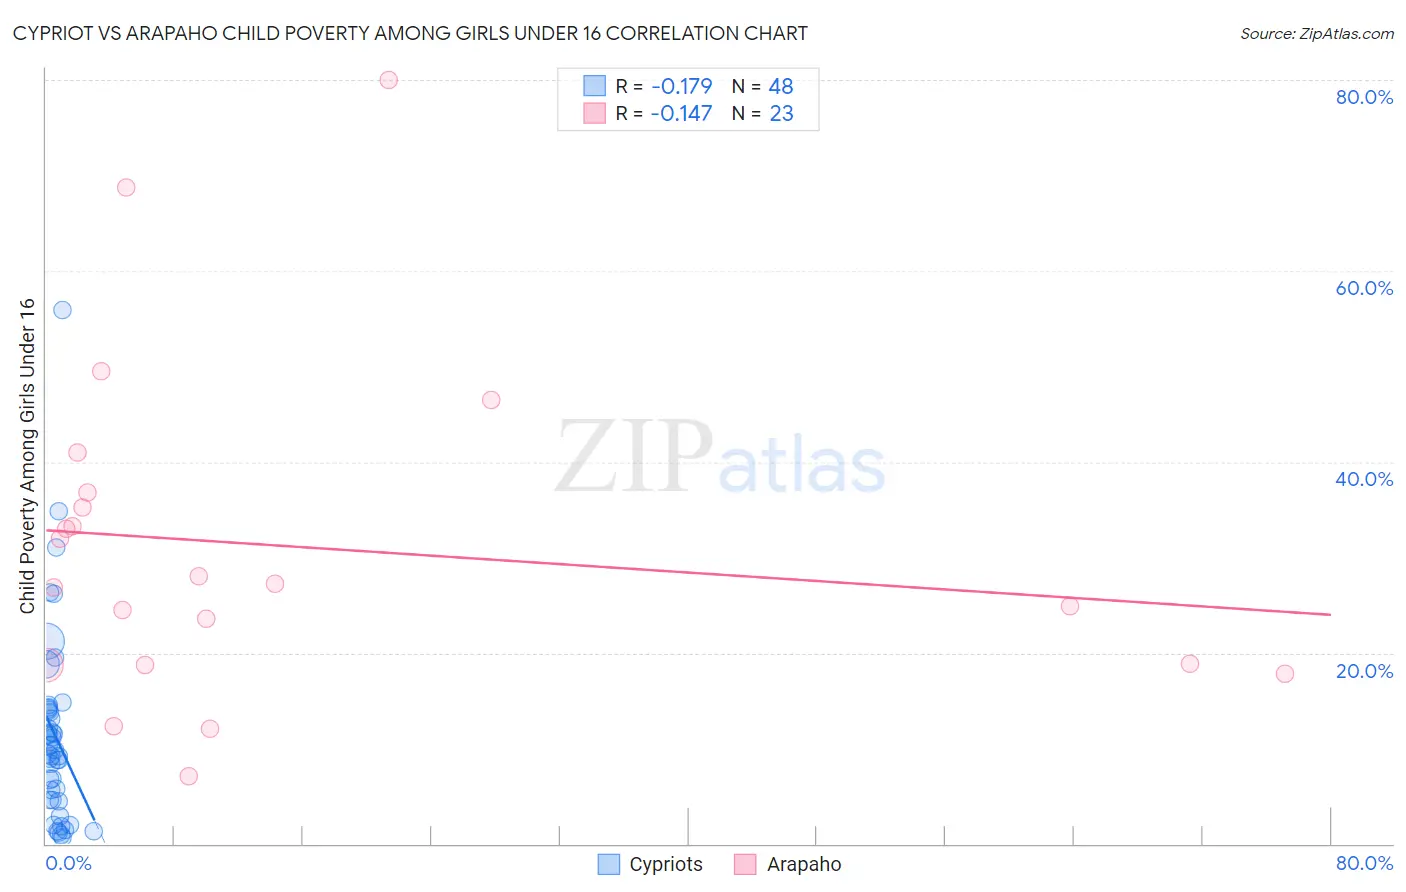
Cypriot vs Arapaho Child Poverty Among Girls Under 16 Correlation Chart

The statistical analysis conducted on geographies consisting of 61,269,149 people shows a poor negative correlation between the proportion of Cypriots and poverty level among girls under the age of 16 in the United States with a correlation coefficient (R) of -0.179 and weighted average of 13.2%. Similarly, the statistical analysis conducted on geographies consisting of 29,689,796 people shows a poor negative correlation between the proportion of Arapaho and poverty level among girls under the age of 16 in the United States with a correlation coefficient (R) of -0.147 and weighted average of 21.7%, a difference of 64.7%.
Cypriot vs Arapaho Child Poverty Among Girls Under 16

Child Poverty Among Girls Under 16 Correlation Summary

MeasurementCypriotArapaho
Minimum0.71%7.0%
Maximum55.9%80.0%
Range55.2%73.0%
Mean11.4%31.1%
Median9.6%27.3%
Interquartile 25% (IQ1)4.6%18.8%
Interquartile 75% (IQ3)14.1%36.8%
Interquartile Range (IQR)9.5%18.0%
Standard Deviation (Sample)10.2%17.4%
Standard Deviation (Population)10.1%17.0%

Similar Demographics by Child Poverty Among Girls Under 16

Demographics Similar to Cypriots by Child Poverty Among Girls Under 16

In terms of child poverty among girls under 16, the demographic groups most similar to Cypriots are Immigrants from Korea (13.1%, a difference of 0.37%), Bulgarian (13.1%, a difference of 0.39%), Immigrants from Lithuania (13.1%, a difference of 0.47%), Immigrants from Japan (13.3%, a difference of 0.66%), and Assyrian/Chaldean/Syriac (13.3%, a difference of 0.78%).
DemographicsRating | RankChild Poverty Among Girls Under 16
Bhutanese
100.0
/100
|
#12
Exceptional
12.7%
Immigrants | Ireland
99.9
/100
|
#13
Exceptional
12.9%
Burmese
99.9
/100
|
#14
Exceptional
13.0%
Okinawans
99.9
/100
|
#15
Exceptional
13.0%
Immigrants | Lithuania
99.9
/100
|
#16
Exceptional
13.1%
Bulgarians
99.9
/100
|
#17
Exceptional
13.1%
Immigrants | Korea
99.9
/100
|
#18
Exceptional
13.1%
Cypriots
99.9
/100
|
#19
Exceptional
13.2%
Immigrants | Japan
99.9
/100
|
#20
Exceptional
13.3%
Assyrians/Chaldeans/Syriacs
99.9
/100
|
#21
Exceptional
13.3%
Indians (Asian)
99.9
/100
|
#22
Exceptional
13.3%
Norwegians
99.9
/100
|
#23
Exceptional
13.3%
Immigrants | Eastern Asia
99.9
/100
|
#24
Exceptional
13.4%
Immigrants | China
99.8
/100
|
#25
Exceptional
13.4%
Eastern Europeans
99.8
/100
|
#26
Exceptional
13.5%

Demographics Similar to Arapaho by Child Poverty Among Girls Under 16

In terms of child poverty among girls under 16, the demographic groups most similar to Arapaho are Creek (21.7%, a difference of 0.010%), Ute (21.8%, a difference of 0.28%), Immigrants from Mexico (21.6%, a difference of 0.51%), Immigrants from Guatemala (21.9%, a difference of 0.55%), and Dutch West Indian (21.6%, a difference of 0.75%).
DemographicsRating | RankChild Poverty Among Girls Under 16
Immigrants | Bahamas
0.0
/100
|
#307
Tragic
21.4%
Houma
0.0
/100
|
#308
Tragic
21.5%
Bahamians
0.0
/100
|
#309
Tragic
21.5%
Immigrants | Somalia
0.0
/100
|
#310
Tragic
21.6%
Dutch West Indians
0.0
/100
|
#311
Tragic
21.6%
Immigrants | Mexico
0.0
/100
|
#312
Tragic
21.6%
Creek
0.0
/100
|
#313
Tragic
21.7%
Arapaho
0.0
/100
|
#314
Tragic
21.7%
Ute
0.0
/100
|
#315
Tragic
21.8%
Immigrants | Guatemala
0.0
/100
|
#316
Tragic
21.9%
Africans
0.0
/100
|
#317
Tragic
21.9%
Immigrants | Dominica
0.0
/100
|
#318
Tragic
22.1%
U.S. Virgin Islanders
0.0
/100
|
#319
Tragic
22.1%
Hondurans
0.0
/100
|
#320
Tragic
22.2%
Colville
0.0
/100
|
#321
Tragic
22.5%