Cuban vs Immigrants from Venezuela Family Poverty
COMPARE
Cuban
Immigrants from Venezuela
Family Poverty
Family Poverty Comparison
Cubans
Immigrants from Venezuela
10.6%
FAMILY POVERTY
0.4/ 100
METRIC RATING
249th/ 347
METRIC RANK
9.3%
FAMILY POVERTY
26.1/ 100
METRIC RATING
196th/ 347
METRIC RANK
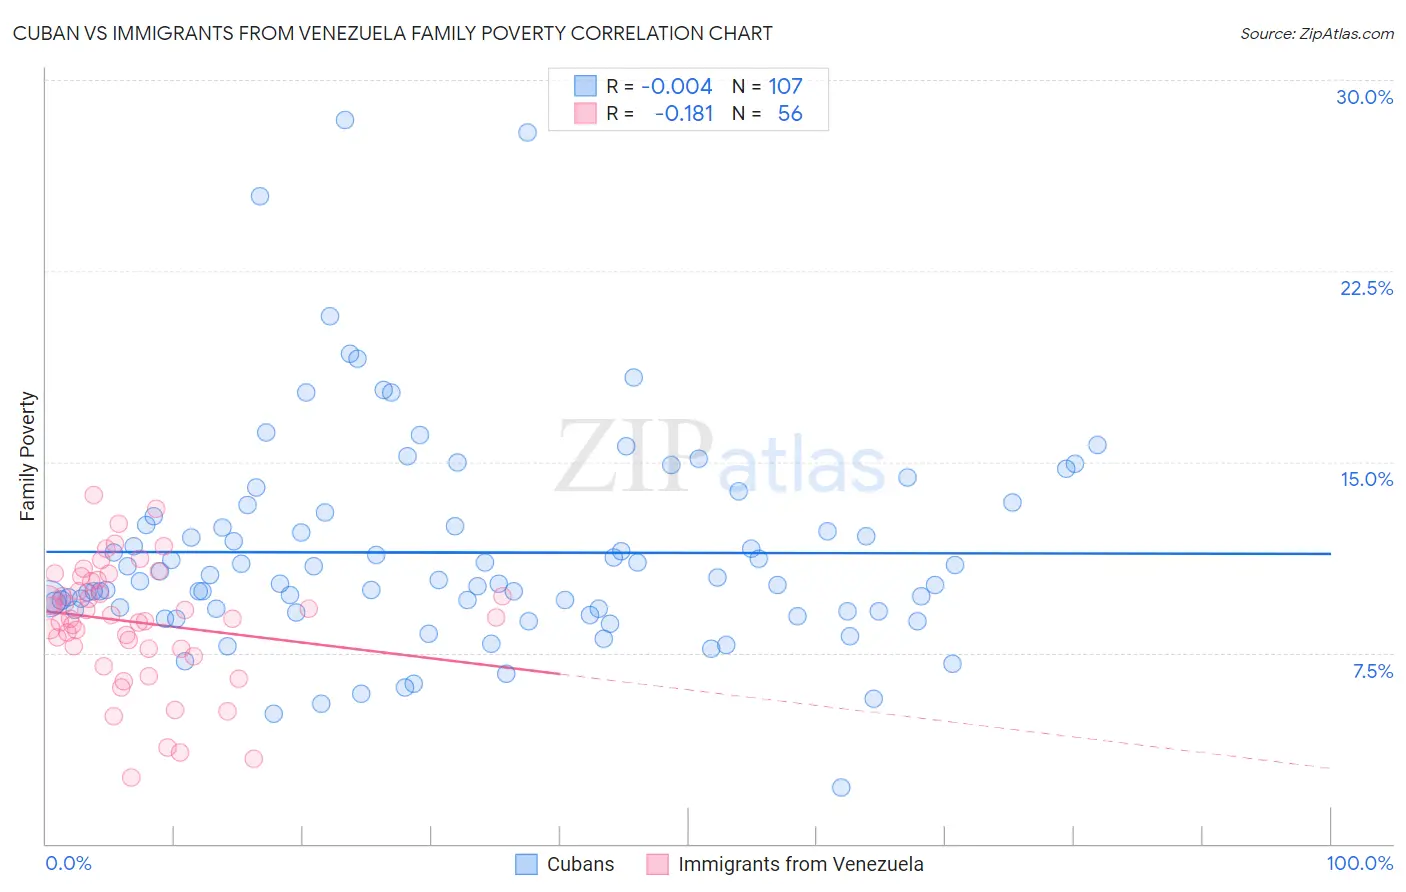
Cuban vs Immigrants from Venezuela Family Poverty Correlation Chart
The statistical analysis conducted on geographies consisting of 447,916,186 people shows no correlation between the proportion of Cubans and poverty level among families in the United States with a correlation coefficient (R) of -0.004 and weighted average of 10.6%. Similarly, the statistical analysis conducted on geographies consisting of 287,460,652 people shows a poor negative correlation between the proportion of Immigrants from Venezuela and poverty level among families in the United States with a correlation coefficient (R) of -0.181 and weighted average of 9.3%, a difference of 14.2%.
Family Poverty Correlation Summary
| Measurement | Cuban | Immigrants from Venezuela |
| Minimum | 2.2% | 2.6% |
| Maximum | 28.4% | 13.7% |
| Range | 26.2% | 11.1% |
| Mean | 11.4% | 8.7% |
| Median | 10.3% | 8.9% |
| Interquartile 25% (IQ1) | 9.1% | 7.7% |
| Interquartile 75% (IQ3) | 12.9% | 10.3% |
| Interquartile Range (IQR) | 3.8% | 2.7% |
| Standard Deviation (Sample) | 4.2% | 2.4% |
| Standard Deviation (Population) | 4.2% | 2.4% |
Similar Demographics by Family Poverty
Demographics Similar to Cubans by Family Poverty
In terms of family poverty, the demographic groups most similar to Cubans are Nicaraguan (10.6%, a difference of 0.050%), Liberian (10.6%, a difference of 0.25%), Cherokee (10.6%, a difference of 0.34%), Salvadoran (10.7%, a difference of 0.53%), and Iroquois (10.7%, a difference of 0.81%).
| Demographics | Rating | Rank | Family Poverty |
| Alaska Natives | 1.0 /100 | #242 | Tragic 10.4% |
| Nepalese | 0.8 /100 | #243 | Tragic 10.4% |
| Cree | 0.7 /100 | #244 | Tragic 10.5% |
| Immigrants | Burma/Myanmar | 0.6 /100 | #245 | Tragic 10.5% |
| Cherokee | 0.5 /100 | #246 | Tragic 10.6% |
| Liberians | 0.4 /100 | #247 | Tragic 10.6% |
| Nicaraguans | 0.4 /100 | #248 | Tragic 10.6% |
| Cubans | 0.4 /100 | #249 | Tragic 10.6% |
| Salvadorans | 0.3 /100 | #250 | Tragic 10.7% |
| Iroquois | 0.3 /100 | #251 | Tragic 10.7% |
| Immigrants | Zaire | 0.3 /100 | #252 | Tragic 10.7% |
| Immigrants | Western Africa | 0.3 /100 | #253 | Tragic 10.7% |
| Ecuadorians | 0.2 /100 | #254 | Tragic 10.8% |
| Immigrants | Liberia | 0.2 /100 | #255 | Tragic 10.8% |
| Chickasaw | 0.2 /100 | #256 | Tragic 10.8% |
Demographics Similar to Immigrants from Venezuela by Family Poverty
In terms of family poverty, the demographic groups most similar to Immigrants from Venezuela are Venezuelan (9.3%, a difference of 0.21%), Immigrants from Colombia (9.3%, a difference of 0.29%), Iraqi (9.3%, a difference of 0.32%), South American (9.3%, a difference of 0.33%), and Immigrants from Western Asia (9.3%, a difference of 0.34%).
| Demographics | Rating | Rank | Family Poverty |
| Immigrants | Afghanistan | 32.1 /100 | #189 | Fair 9.2% |
| Arabs | 31.5 /100 | #190 | Fair 9.2% |
| Ugandans | 28.7 /100 | #191 | Fair 9.3% |
| Spanish | 28.7 /100 | #192 | Fair 9.3% |
| Immigrants | Western Asia | 28.2 /100 | #193 | Fair 9.3% |
| South Americans | 28.1 /100 | #194 | Fair 9.3% |
| Venezuelans | 27.4 /100 | #195 | Fair 9.3% |
| Immigrants | Venezuela | 26.1 /100 | #196 | Fair 9.3% |
| Immigrants | Colombia | 24.4 /100 | #197 | Fair 9.3% |
| Iraqis | 24.2 /100 | #198 | Fair 9.3% |
| Spaniards | 22.8 /100 | #199 | Fair 9.4% |
| Immigrants | Costa Rica | 21.7 /100 | #200 | Fair 9.4% |
| Immigrants | Portugal | 20.5 /100 | #201 | Fair 9.4% |
| Immigrants | Sierra Leone | 19.6 /100 | #202 | Poor 9.4% |
| German Russians | 19.4 /100 | #203 | Poor 9.4% |