Cuban vs Alsatian Child Poverty Under the Age of 16
COMPARE
Cuban
Alsatian
Child Poverty Under the Age of 16
Child Poverty Under the Age of 16 Comparison
Cubans
Alsatians
17.8%
CHILD POVERTY UNDER THE AGE OF 16
3.7/ 100
METRIC RATING
221st/ 347
METRIC RANK
18.6%
CHILD POVERTY UNDER THE AGE OF 16
0.7/ 100
METRIC RATING
241st/ 347
METRIC RANK
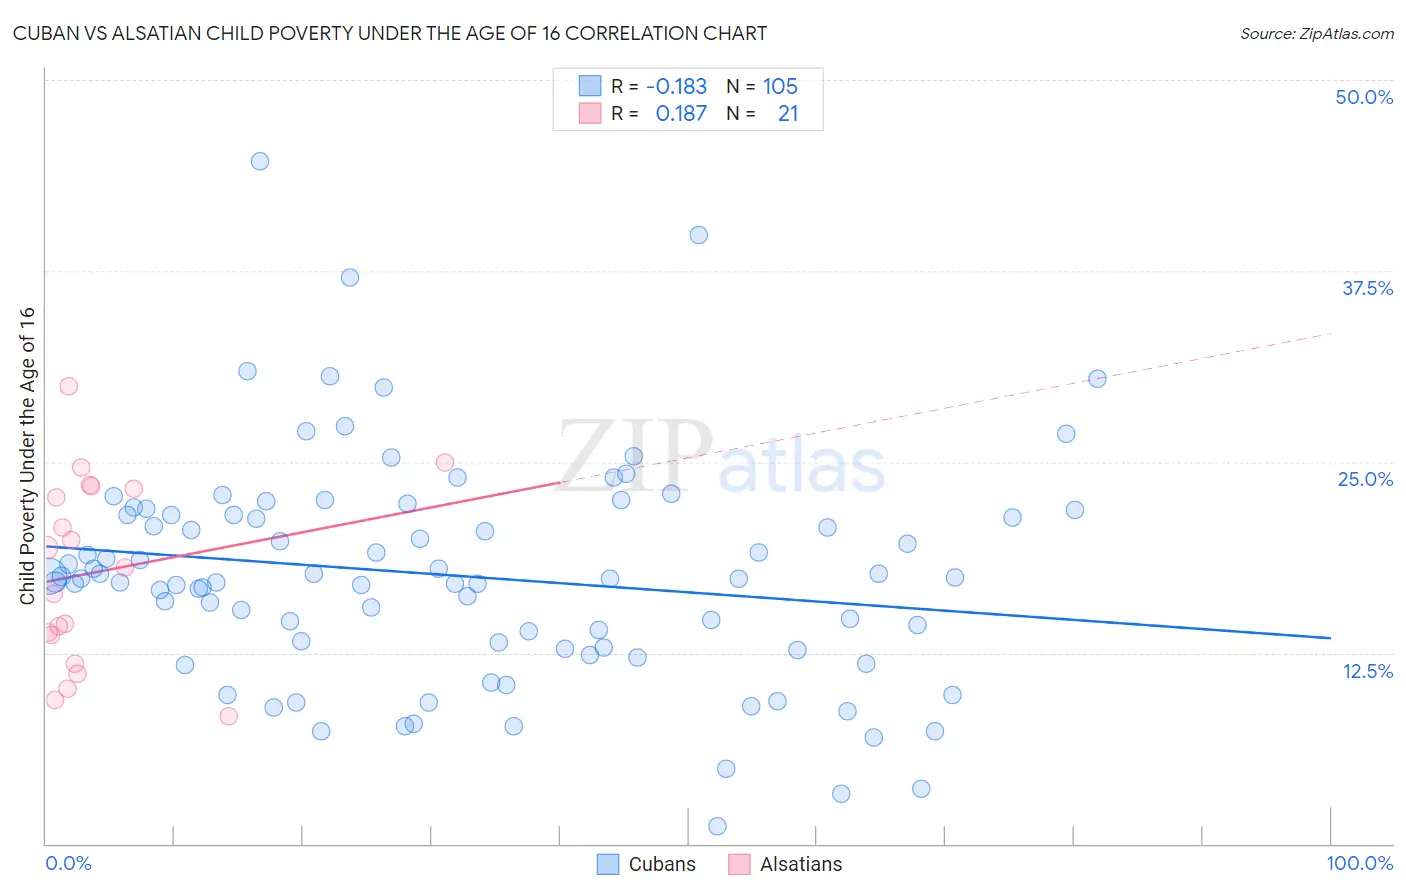
Cuban vs Alsatian Child Poverty Under the Age of 16 Correlation Chart
The statistical analysis conducted on geographies consisting of 444,662,499 people shows a poor negative correlation between the proportion of Cubans and poverty level among children under the age of 16 in the United States with a correlation coefficient (R) of -0.183 and weighted average of 17.8%. Similarly, the statistical analysis conducted on geographies consisting of 82,344,359 people shows a poor positive correlation between the proportion of Alsatians and poverty level among children under the age of 16 in the United States with a correlation coefficient (R) of 0.187 and weighted average of 18.6%, a difference of 4.8%.
Child Poverty Under the Age of 16 Correlation Summary
| Measurement | Cuban | Alsatian |
| Minimum | 1.1% | 8.3% |
| Maximum | 44.7% | 30.0% |
| Range | 43.5% | 21.6% |
| Mean | 17.6% | 17.8% |
| Median | 17.3% | 18.1% |
| Interquartile 25% (IQ1) | 12.8% | 12.8% |
| Interquartile 75% (IQ3) | 21.5% | 23.3% |
| Interquartile Range (IQR) | 8.7% | 10.6% |
| Standard Deviation (Sample) | 7.3% | 6.1% |
| Standard Deviation (Population) | 7.3% | 5.9% |
Demographics Similar to Cubans and Alsatians by Child Poverty Under the Age of 16
In terms of child poverty under the age of 16, the demographic groups most similar to Cubans are Immigrants from Armenia (17.8%, a difference of 0.060%), Immigrants from Cambodia (17.8%, a difference of 0.30%), Osage (17.9%, a difference of 0.53%), Nonimmigrants (17.9%, a difference of 0.90%), and Bermudan (18.0%, a difference of 0.97%). Similarly, the demographic groups most similar to Alsatians are Ghanaian (18.6%, a difference of 0.46%), Immigrants from Sudan (18.5%, a difference of 0.51%), Immigrants from Eritrea (18.5%, a difference of 0.55%), Sudanese (18.5%, a difference of 0.79%), and Cree (18.5%, a difference of 0.82%).
| Demographics | Rating | Rank | Child Poverty Under the Age of 16 |
| Cubans | 3.7 /100 | #221 | Tragic 17.8% |
| Immigrants | Armenia | 3.6 /100 | #222 | Tragic 17.8% |
| Immigrants | Cambodia | 3.3 /100 | #223 | Tragic 17.8% |
| Osage | 3.1 /100 | #224 | Tragic 17.9% |
| Immigrants | Nonimmigrants | 2.7 /100 | #225 | Tragic 17.9% |
| Bermudans | 2.6 /100 | #226 | Tragic 18.0% |
| Immigrants | Africa | 2.5 /100 | #227 | Tragic 18.0% |
| Immigrants | Micronesia | 2.3 /100 | #228 | Tragic 18.0% |
| Marshallese | 1.8 /100 | #229 | Tragic 18.1% |
| Nepalese | 1.7 /100 | #230 | Tragic 18.2% |
| Nicaraguans | 1.7 /100 | #231 | Tragic 18.2% |
| Americans | 1.2 /100 | #232 | Tragic 18.3% |
| Fijians | 1.1 /100 | #233 | Tragic 18.4% |
| Immigrants | Nigeria | 1.0 /100 | #234 | Tragic 18.4% |
| Nigerians | 1.0 /100 | #235 | Tragic 18.4% |
| Cree | 0.9 /100 | #236 | Tragic 18.5% |
| Sudanese | 0.9 /100 | #237 | Tragic 18.5% |
| Immigrants | Eritrea | 0.8 /100 | #238 | Tragic 18.5% |
| Immigrants | Sudan | 0.8 /100 | #239 | Tragic 18.5% |
| Ghanaians | 0.8 /100 | #240 | Tragic 18.6% |
| Alsatians | 0.7 /100 | #241 | Tragic 18.6% |