Crow vs Immigrants from Uruguay Male Poverty
COMPARE
Crow
Immigrants from Uruguay
Male Poverty
Male Poverty Comparison
Crow
Immigrants from Uruguay
19.1%
MALE POVERTY
0.0/ 100
METRIC RATING
338th/ 347
METRIC RANK
11.6%
MALE POVERTY
19.1/ 100
METRIC RATING
192nd/ 347
METRIC RANK
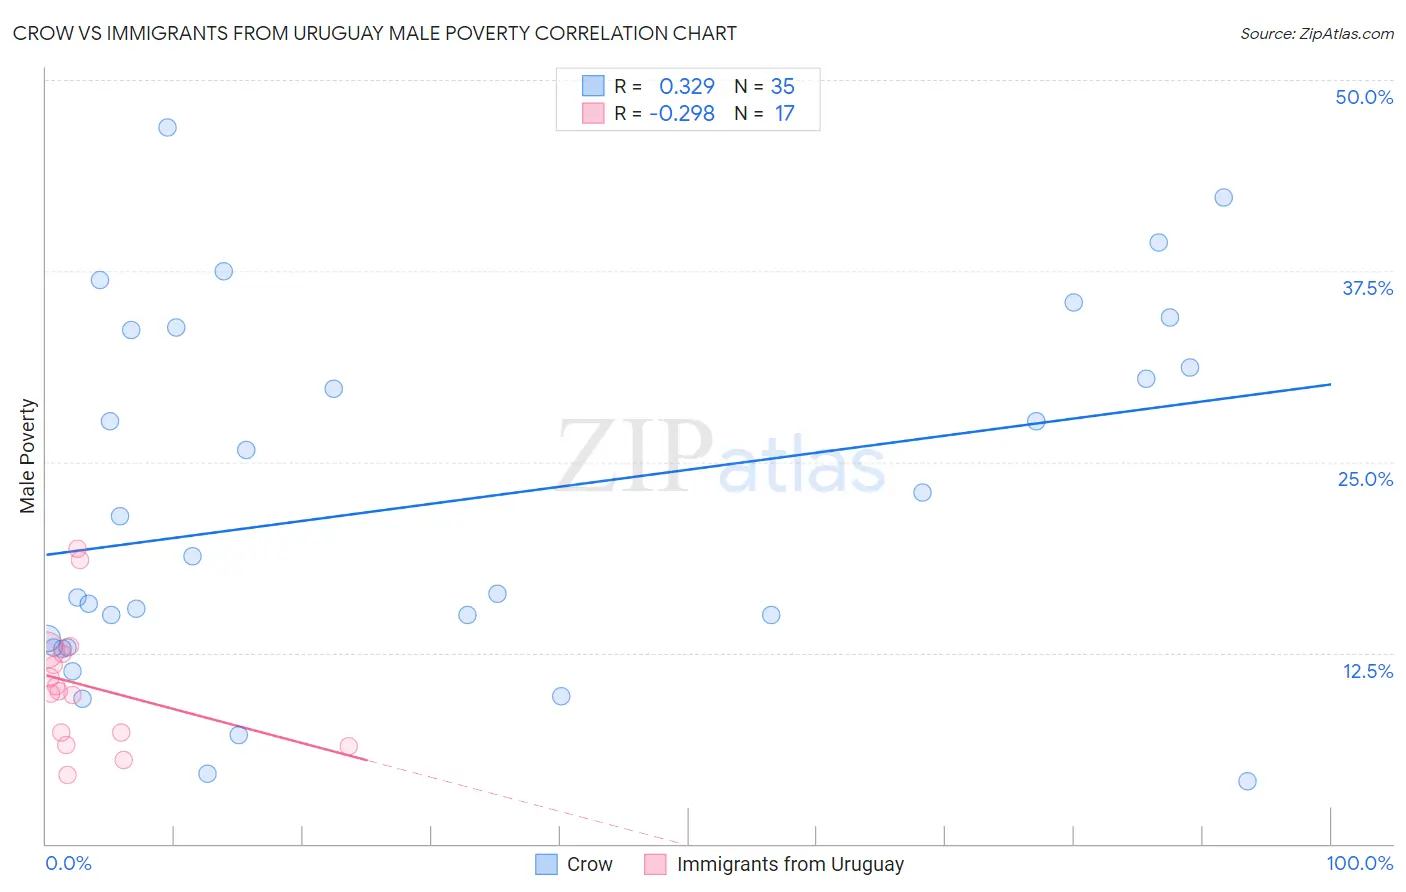
Crow vs Immigrants from Uruguay Male Poverty Correlation Chart
The statistical analysis conducted on geographies consisting of 59,196,119 people shows a mild positive correlation between the proportion of Crow and poverty level among males in the United States with a correlation coefficient (R) of 0.329 and weighted average of 19.1%. Similarly, the statistical analysis conducted on geographies consisting of 133,238,599 people shows a weak negative correlation between the proportion of Immigrants from Uruguay and poverty level among males in the United States with a correlation coefficient (R) of -0.298 and weighted average of 11.6%, a difference of 65.2%.
Male Poverty Correlation Summary
| Measurement | Crow | Immigrants from Uruguay |
| Minimum | 4.1% | 4.5% |
| Maximum | 46.9% | 19.3% |
| Range | 42.8% | 14.8% |
| Mean | 22.4% | 10.3% |
| Median | 18.8% | 10.0% |
| Interquartile 25% (IQ1) | 12.8% | 6.9% |
| Interquartile 75% (IQ3) | 33.6% | 12.6% |
| Interquartile Range (IQR) | 20.8% | 5.7% |
| Standard Deviation (Sample) | 11.6% | 4.1% |
| Standard Deviation (Population) | 11.5% | 4.0% |
Similar Demographics by Male Poverty
Demographics Similar to Crow by Male Poverty
In terms of male poverty, the demographic groups most similar to Crow are Yuman (19.5%, a difference of 2.2%), Sioux (18.7%, a difference of 2.3%), Pueblo (18.5%, a difference of 3.4%), Immigrants from Yemen (20.1%, a difference of 5.3%), and Lumbee (20.2%, a difference of 5.6%).
| Demographics | Rating | Rank | Male Poverty |
| Ute | 0.0 /100 | #331 | Tragic 16.2% |
| Houma | 0.0 /100 | #332 | Tragic 16.7% |
| Natives/Alaskans | 0.0 /100 | #333 | Tragic 16.9% |
| Cheyenne | 0.0 /100 | #334 | Tragic 17.6% |
| Apache | 0.0 /100 | #335 | Tragic 17.7% |
| Pueblo | 0.0 /100 | #336 | Tragic 18.5% |
| Sioux | 0.0 /100 | #337 | Tragic 18.7% |
| Crow | 0.0 /100 | #338 | Tragic 19.1% |
| Yuman | 0.0 /100 | #339 | Tragic 19.5% |
| Immigrants | Yemen | 0.0 /100 | #340 | Tragic 20.1% |
| Lumbee | 0.0 /100 | #341 | Tragic 20.2% |
| Pima | 0.0 /100 | #342 | Tragic 20.4% |
| Yup'ik | 0.0 /100 | #343 | Tragic 20.4% |
| Hopi | 0.0 /100 | #344 | Tragic 20.8% |
| Puerto Ricans | 0.0 /100 | #345 | Tragic 22.0% |
Demographics Similar to Immigrants from Uruguay by Male Poverty
In terms of male poverty, the demographic groups most similar to Immigrants from Uruguay are Immigrants from Kuwait (11.6%, a difference of 0.29%), Immigrants from Kenya (11.6%, a difference of 0.50%), South American Indian (11.5%, a difference of 0.52%), Arab (11.6%, a difference of 0.55%), and Hmong (11.6%, a difference of 0.56%).
| Demographics | Rating | Rank | Male Poverty |
| Immigrants | Afghanistan | 33.3 /100 | #185 | Fair 11.4% |
| Immigrants | Sierra Leone | 32.9 /100 | #186 | Fair 11.4% |
| Immigrants | Iraq | 31.9 /100 | #187 | Fair 11.4% |
| Sierra Leoneans | 29.9 /100 | #188 | Fair 11.4% |
| Hawaiians | 28.3 /100 | #189 | Fair 11.4% |
| Israelis | 26.1 /100 | #190 | Fair 11.5% |
| South American Indians | 22.8 /100 | #191 | Fair 11.5% |
| Immigrants | Uruguay | 19.1 /100 | #192 | Poor 11.6% |
| Immigrants | Kuwait | 17.3 /100 | #193 | Poor 11.6% |
| Immigrants | Kenya | 16.1 /100 | #194 | Poor 11.6% |
| Arabs | 15.8 /100 | #195 | Poor 11.6% |
| Hmong | 15.8 /100 | #196 | Poor 11.6% |
| Delaware | 15.4 /100 | #197 | Poor 11.7% |
| Iraqis | 14.7 /100 | #198 | Poor 11.7% |
| Spanish | 14.1 /100 | #199 | Poor 11.7% |