Creek vs Immigrants from Europe Family Poverty
COMPARE
Creek
Immigrants from Europe
Family Poverty
Family Poverty Comparison
Creek
Immigrants from Europe
11.7%
FAMILY POVERTY
0.0/ 100
METRIC RATING
297th/ 347
METRIC RANK
7.9%
FAMILY POVERTY
97.8/ 100
METRIC RATING
79th/ 347
METRIC RANK
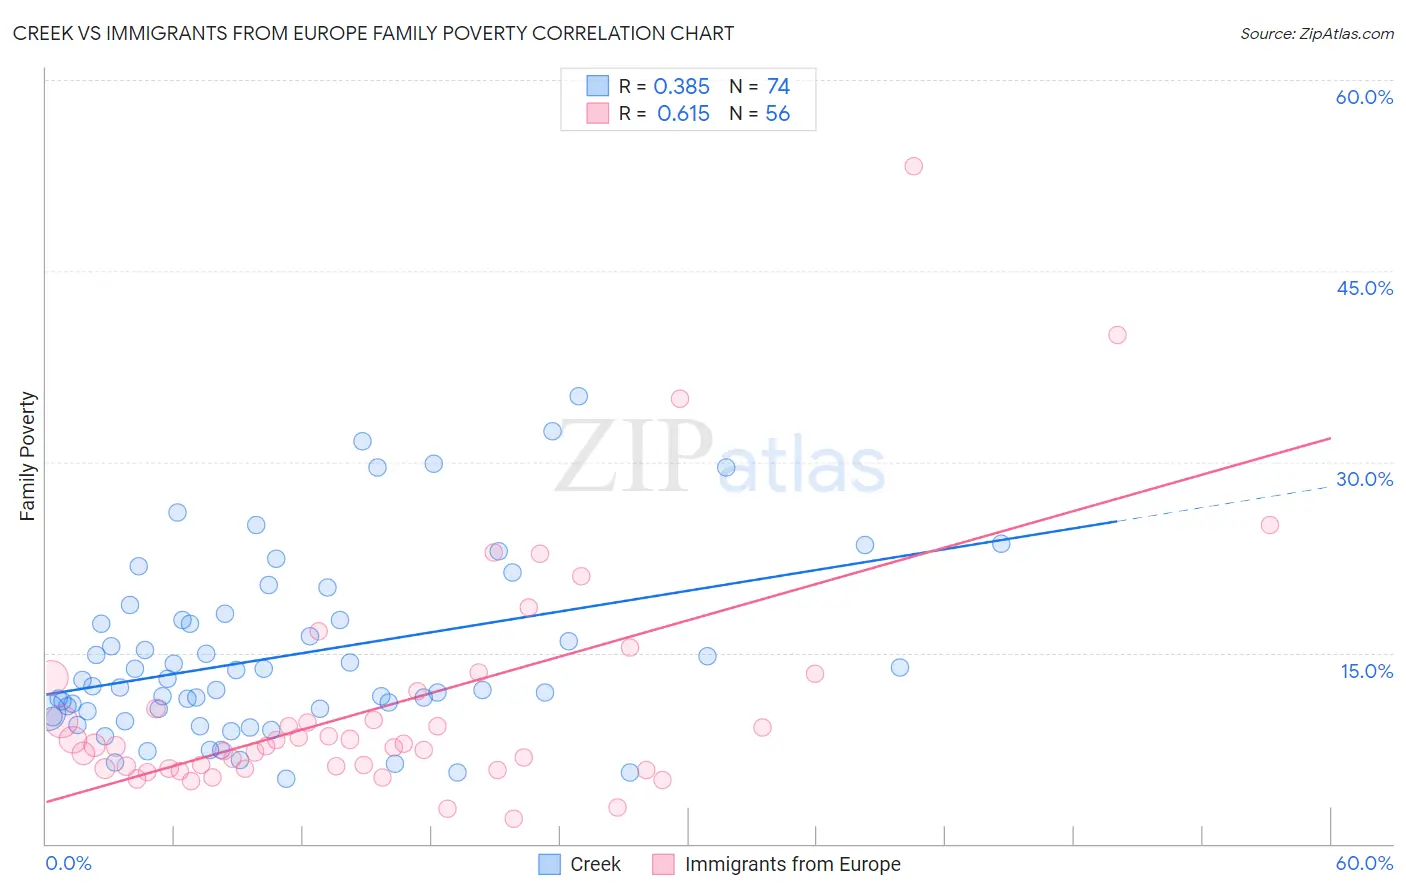
Creek vs Immigrants from Europe Family Poverty Correlation Chart
The statistical analysis conducted on geographies consisting of 178,327,636 people shows a mild positive correlation between the proportion of Creek and poverty level among families in the United States with a correlation coefficient (R) of 0.385 and weighted average of 11.7%. Similarly, the statistical analysis conducted on geographies consisting of 543,618,397 people shows a significant positive correlation between the proportion of Immigrants from Europe and poverty level among families in the United States with a correlation coefficient (R) of 0.615 and weighted average of 7.9%, a difference of 47.8%.
Family Poverty Correlation Summary
| Measurement | Creek | Immigrants from Europe |
| Minimum | 5.1% | 1.9% |
| Maximum | 35.2% | 53.2% |
| Range | 30.1% | 51.3% |
| Mean | 14.8% | 10.9% |
| Median | 12.6% | 7.7% |
| Interquartile 25% (IQ1) | 10.4% | 5.9% |
| Interquartile 75% (IQ3) | 17.6% | 11.3% |
| Interquartile Range (IQR) | 7.2% | 5.4% |
| Standard Deviation (Sample) | 7.0% | 9.3% |
| Standard Deviation (Population) | 6.9% | 9.2% |
Similar Demographics by Family Poverty
Demographics Similar to Creek by Family Poverty
In terms of family poverty, the demographic groups most similar to Creek are Immigrants from Senegal (11.7%, a difference of 0.14%), Choctaw (11.6%, a difference of 0.23%), Dutch West Indian (11.7%, a difference of 0.24%), Immigrants from Bangladesh (11.7%, a difference of 0.25%), and Immigrants from Haiti (11.6%, a difference of 0.28%).
| Demographics | Rating | Rank | Family Poverty |
| West Indians | 0.0 /100 | #290 | Tragic 11.5% |
| Haitians | 0.0 /100 | #291 | Tragic 11.5% |
| Immigrants | Somalia | 0.0 /100 | #292 | Tragic 11.5% |
| Immigrants | Cabo Verde | 0.0 /100 | #293 | Tragic 11.6% |
| Immigrants | St. Vincent and the Grenadines | 0.0 /100 | #294 | Tragic 11.6% |
| Immigrants | Haiti | 0.0 /100 | #295 | Tragic 11.6% |
| Choctaw | 0.0 /100 | #296 | Tragic 11.6% |
| Creek | 0.0 /100 | #297 | Tragic 11.7% |
| Immigrants | Senegal | 0.0 /100 | #298 | Tragic 11.7% |
| Dutch West Indians | 0.0 /100 | #299 | Tragic 11.7% |
| Immigrants | Bangladesh | 0.0 /100 | #300 | Tragic 11.7% |
| Bahamians | 0.0 /100 | #301 | Tragic 11.7% |
| Guatemalans | 0.0 /100 | #302 | Tragic 11.7% |
| Africans | 0.0 /100 | #303 | Tragic 11.8% |
| Immigrants | Latin America | 0.0 /100 | #304 | Tragic 11.8% |
Demographics Similar to Immigrants from Europe by Family Poverty
In terms of family poverty, the demographic groups most similar to Immigrants from Europe are English (7.9%, a difference of 0.060%), Irish (7.9%, a difference of 0.070%), Immigrants from North America (7.9%, a difference of 0.080%), Immigrants from Poland (7.9%, a difference of 0.090%), and Ukrainian (7.9%, a difference of 0.19%).
| Demographics | Rating | Rank | Family Poverty |
| Immigrants | Romania | 98.2 /100 | #72 | Exceptional 7.8% |
| Austrians | 98.2 /100 | #73 | Exceptional 7.8% |
| Immigrants | China | 98.1 /100 | #74 | Exceptional 7.8% |
| Immigrants | Croatia | 98.1 /100 | #75 | Exceptional 7.8% |
| Immigrants | Latvia | 98.0 /100 | #76 | Exceptional 7.9% |
| Ukrainians | 98.0 /100 | #77 | Exceptional 7.9% |
| Immigrants | North America | 97.9 /100 | #78 | Exceptional 7.9% |
| Immigrants | Europe | 97.8 /100 | #79 | Exceptional 7.9% |
| English | 97.8 /100 | #80 | Exceptional 7.9% |
| Irish | 97.8 /100 | #81 | Exceptional 7.9% |
| Immigrants | Poland | 97.8 /100 | #82 | Exceptional 7.9% |
| Slovaks | 97.7 /100 | #83 | Exceptional 7.9% |
| British | 97.5 /100 | #84 | Exceptional 7.9% |
| Immigrants | Asia | 97.4 /100 | #85 | Exceptional 7.9% |
| Scottish | 97.3 /100 | #86 | Exceptional 7.9% |