Creek vs Burmese Seniors Poverty Over the Age of 65

COMPARE

Creek
Race
Ancestry
AfghanAfricanAlaska NativeAlaskan AthabascanAlbanianAleutAlsatianAmericanApacheArabArapahoArgentineanArmenianAssyrian/Chaldean/SyriacAustralianAustrianBahamianBangladeshiBarbadianBasqueBelgianBelizeanBermudanBhutaneseBlackfeetBolivianBrazilianBritishBritish West IndianBulgarianCajunCambodianCanadianCape VerdeanCarpatho RusynCelticCentral AmericanCentral American IndianCherokeeCheyenneChickasawChileanChineseChippewaChoctawColombianColvilleComancheCosta RicanCreeCreekCroatianCrowCubanCypriotCzechCzechoslovakianDanishDelawareDominicanDutchDutch West IndianEastern EuropeanEcuadorianEgyptianEnglishEstonianEthiopianEuropeanFijianFilipinoFinnishFrenchFrench American IndianFrench CanadianGermanGerman RussianGhanaianGreekGuamanian/ChamorroGuatemalanGuyaneseHaitianHmongHonduranHopiHoumaHungarianIcelanderIndian (Asian)IndonesianInupiatIranianIraqiIrishIroquoisIsraeliItalianJamaicanJapaneseJordanianKenyanKiowaKoreanLaotianLatvianLebaneseLiberianLithuanianLumbeeLuxembourgerMacedonianMalaysianMalteseMarshalleseMenomineeMexicanMexican American IndianMongolianMoroccanNative HawaiianNavajoNepaleseNew ZealanderNicaraguanNigerianNorthern EuropeanNorwegianOkinawanOsageOttawaPaiutePakistaniPalestinianPanamanianParaguayanPennsylvania GermanPeruvianPimaPolishPortuguesePotawatomiPuebloPuerto RicanPuget Sound SalishRomanianRussianSalvadoranSamoanScandinavianScotch-IrishScottishSeminoleSenegaleseSerbianShoshoneSierra LeoneanSiouxSlavicSlovakSloveneSomaliSouth AfricanSouth AmericanSouth American IndianSoviet UnionSpaniardSpanishSpanish AmericanSpanish American IndianSri LankanSubsaharan AfricanSudaneseSwedishSwissSyrianTaiwaneseThaiTlingit-HaidaTohono O'OdhamTonganTrinidadian and TobagonianTsimshianTurkishU.S. Virgin IslanderUgandanUkrainianUruguayanUteVenezuelanVietnameseWelshWest IndianYakamaYaquiYugoslavianYumanYup'ikZimbabwean
Immigration
NonimmigrantsImmigrantsAfghanistanAfricaAlbaniaArgentinaArmeniaAsiaAustraliaAustriaBahamasBangladeshBarbadosBelarusBelgiumBelizeBoliviaBosnia and HerzegovinaBrazilBulgariaBurma/MyanmarCabo VerdeCambodiaCameroonCanadaCaribbeanCentral AmericaChileChinaColombiaCongoCosta RicaCroatiaCubaCzechoslovakiaDenmarkDominicaDominican RepublicEastern AfricaEastern AsiaEastern EuropeEcuadorEgyptEl SalvadorEnglandEritreaEthiopiaEuropeFijiFranceGermanyGhanaGreeceGrenadaGuatemalaGuyanaHaitiHondurasHong KongHungaryIndiaIndonesiaIranIraqIrelandIsraelItalyJamaicaJapanJordanKazakhstanKenyaKoreaKuwaitLaosLatin AmericaLatviaLebanonLiberiaLithuaniaMalaysiaMexicoMicronesiaMiddle AfricaMoldovaMoroccoNepalNetherlandsNicaraguaNigeriaNorth AmericaNorth MacedoniaNorthern AfricaNorthern EuropeNorwayOceaniaPakistanPanamaPeruPhilippinesPolandPortugalRomaniaRussiaSaudi ArabiaScotlandSenegalSerbiaSierra LeoneSingaporeSomaliaSouth AfricaSouth AmericaSouth Central AsiaSouth Eastern AsiaSouthern EuropeSpainSri LankaSt. Vincent and the GrenadinesSudanSwedenSwitzerlandSyriaTaiwanThailandTrinidad and TobagoTurkeyUgandaUkraineUruguayUzbekistanVenezuelaVietnamWest IndiesWestern AfricaWestern AsiaWestern EuropeYemenZaireZimbabweAzores
Burmese
Race
Ancestry
AfghanAfricanAlaska NativeAlaskan AthabascanAlbanianAleutAlsatianAmericanApacheArabArapahoArgentineanArmenianAssyrian/Chaldean/SyriacAustralianAustrianBahamianBangladeshiBarbadianBasqueBelgianBelizeanBermudanBhutaneseBlackfeetBolivianBrazilianBritishBritish West IndianBulgarianBurmeseCajunCambodianCanadianCape VerdeanCarpatho RusynCelticCentral AmericanCentral American IndianCherokeeCheyenneChickasawChileanChineseChippewaChoctawColombianColvilleComancheCosta RicanCreeCroatianCrowCubanCypriotCzechCzechoslovakianDanishDelawareDominicanDutchDutch West IndianEastern EuropeanEcuadorianEgyptianEnglishEstonianEthiopianEuropeanFijianFilipinoFinnishFrenchFrench American IndianFrench CanadianGermanGerman RussianGhanaianGreekGuamanian/ChamorroGuatemalanGuyaneseHaitianHmongHonduranHopiHoumaHungarianIcelanderIndian (Asian)IndonesianInupiatIranianIraqiIrishIroquoisIsraeliItalianJamaicanJapaneseJordanianKenyanKiowaKoreanLaotianLatvianLebaneseLiberianLithuanianLumbeeLuxembourgerMacedonianMalaysianMalteseMarshalleseMenomineeMexicanMexican American IndianMongolianMoroccanNative HawaiianNavajoNepaleseNew ZealanderNicaraguanNigerianNorthern EuropeanNorwegianOkinawanOsageOttawaPaiutePakistaniPalestinianPanamanianParaguayanPennsylvania GermanPeruvianPimaPolishPortuguesePotawatomiPuebloPuerto RicanPuget Sound SalishRomanianRussianSalvadoranSamoanScandinavianScotch-IrishScottishSeminoleSenegaleseSerbianShoshoneSierra LeoneanSiouxSlavicSlovakSloveneSomaliSouth AfricanSouth AmericanSouth American IndianSoviet UnionSpaniardSpanishSpanish AmericanSpanish American IndianSri LankanSubsaharan AfricanSudaneseSwedishSwissSyrianTaiwaneseThaiTlingit-HaidaTohono O'OdhamTonganTrinidadian and TobagonianTsimshianTurkishU.S. Virgin IslanderUgandanUkrainianUruguayanUteVenezuelanVietnameseWelshWest IndianYakamaYaquiYugoslavianYumanYup'ikZimbabwean
Immigration
NonimmigrantsImmigrantsAfghanistanAfricaAlbaniaArgentinaArmeniaAsiaAustraliaAustriaBahamasBangladeshBarbadosBelarusBelgiumBelizeBoliviaBosnia and HerzegovinaBrazilBulgariaBurma/MyanmarCabo VerdeCambodiaCameroonCanadaCaribbeanCentral AmericaChileChinaColombiaCongoCosta RicaCroatiaCubaCzechoslovakiaDenmarkDominicaDominican RepublicEastern AfricaEastern AsiaEastern EuropeEcuadorEgyptEl SalvadorEnglandEritreaEthiopiaEuropeFijiFranceGermanyGhanaGreeceGrenadaGuatemalaGuyanaHaitiHondurasHong KongHungaryIndiaIndonesiaIranIraqIrelandIsraelItalyJamaicaJapanJordanKazakhstanKenyaKoreaKuwaitLaosLatin AmericaLatviaLebanonLiberiaLithuaniaMalaysiaMexicoMicronesiaMiddle AfricaMoldovaMoroccoNepalNetherlandsNicaraguaNigeriaNorth AmericaNorth MacedoniaNorthern AfricaNorthern EuropeNorwayOceaniaPakistanPanamaPeruPhilippinesPolandPortugalRomaniaRussiaSaudi ArabiaScotlandSenegalSerbiaSierra LeoneSingaporeSomaliaSouth AfricaSouth AmericaSouth Central AsiaSouth Eastern AsiaSouthern EuropeSpainSri LankaSt. Vincent and the GrenadinesSudanSwedenSwitzerlandSyriaTaiwanThailandTrinidad and TobagoTurkeyUgandaUkraineUruguayUzbekistanVenezuelaVietnamWest IndiesWestern AfricaWestern AsiaWestern EuropeYemenZaireZimbabweAzores
Seniors Poverty Over the Age of 65
Income
Poverty
Unemployment
Labor Participation
Family Structure
Vehicle Availability
Education Level
Disability

Seniors Poverty Over the Age of 65 Comparison

Creek

Burmese

Average
Exceptional
10.9%
SENIORS POVERTY OVER THE AGE OF 65
49.6/ 100
METRIC RATING
175th/ 347
METRIC RANK
10.1%
SENIORS POVERTY OVER THE AGE OF 65
97.2/ 100
METRIC RATING
87th/ 347
METRIC RANK

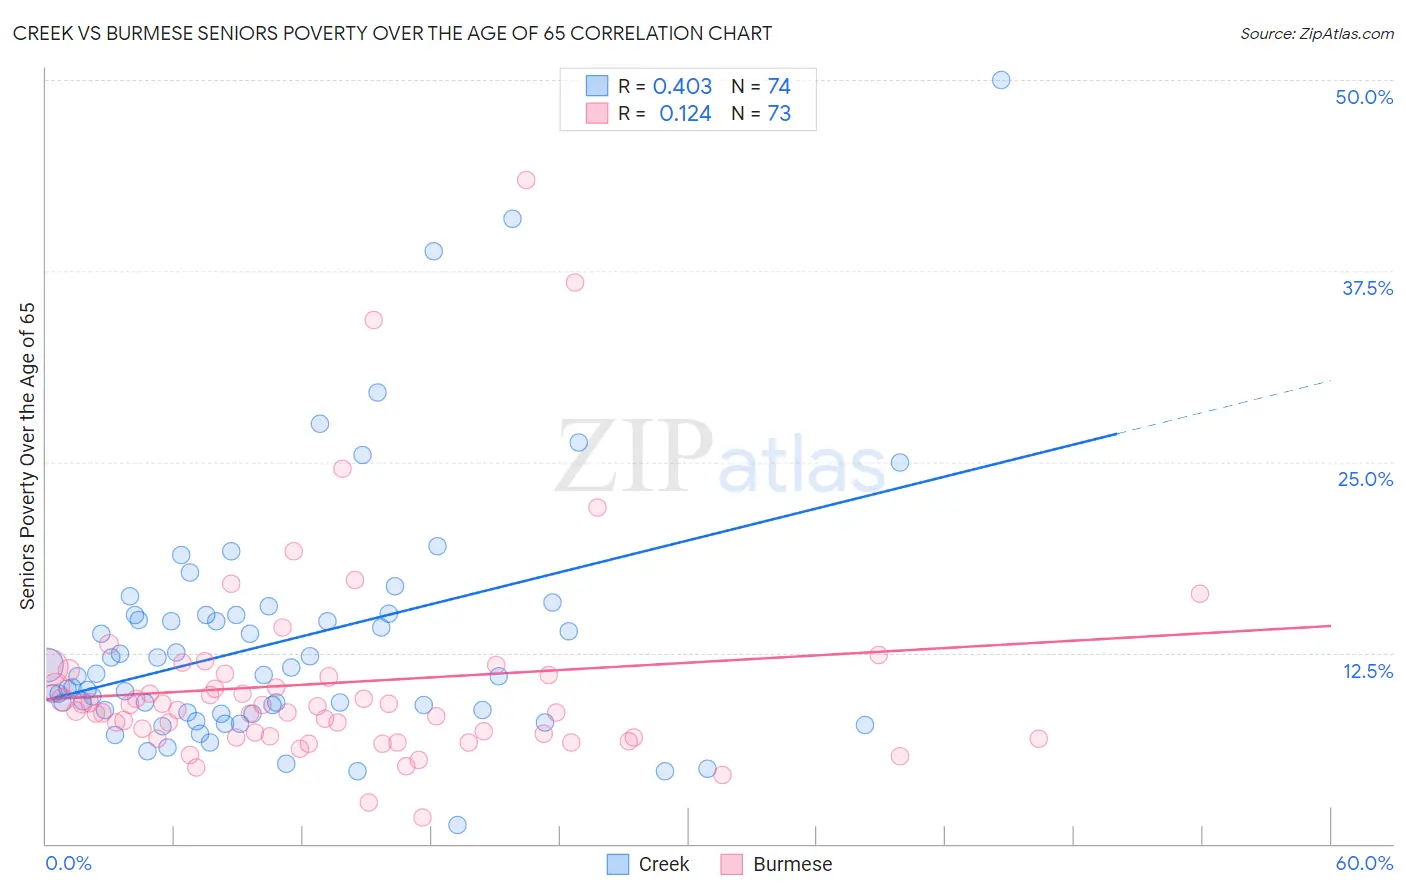
Creek vs Burmese Seniors Poverty Over the Age of 65 Correlation Chart

The statistical analysis conducted on geographies consisting of 178,107,079 people shows a moderate positive correlation between the proportion of Creek and poverty level among seniors over the age of 65 in the United States with a correlation coefficient (R) of 0.403 and weighted average of 10.9%. Similarly, the statistical analysis conducted on geographies consisting of 462,767,896 people shows a poor positive correlation between the proportion of Burmese and poverty level among seniors over the age of 65 in the United States with a correlation coefficient (R) of 0.124 and weighted average of 10.1%, a difference of 8.6%.
Creek vs Burmese Seniors Poverty Over the Age of 65

Seniors Poverty Over the Age of 65 Correlation Summary

MeasurementCreekBurmese
Minimum1.2%1.7%
Maximum50.0%43.5%
Range48.8%41.8%
Mean13.3%10.5%
Median11.0%8.7%
Interquartile 25% (IQ1)8.6%7.0%
Interquartile 75% (IQ3)15.0%11.1%
Interquartile Range (IQR)6.4%4.1%
Standard Deviation (Sample)8.3%7.0%
Standard Deviation (Population)8.2%6.9%

Similar Demographics by Seniors Poverty Over the Age of 65

Demographics Similar to Creek by Seniors Poverty Over the Age of 65

In terms of seniors poverty over the age of 65, the demographic groups most similar to Creek are Immigrants from Sudan (10.9%, a difference of 0.040%), Spaniard (10.9%, a difference of 0.10%), Immigrants from Malaysia (11.0%, a difference of 0.15%), Cherokee (11.0%, a difference of 0.20%), and German Russian (11.0%, a difference of 0.24%).
DemographicsRating | RankSeniors Poverty Over the Age of 65
Mongolians
58.0
/100
|
#168
Average
10.9%
Sri Lankans
56.8
/100
|
#169
Average
10.9%
Immigrants | Eastern Europe
55.8
/100
|
#170
Average
10.9%
Immigrants | Nonimmigrants
55.1
/100
|
#171
Average
10.9%
Immigrants | Syria
54.7
/100
|
#172
Average
10.9%
Spaniards
50.7
/100
|
#173
Average
10.9%
Immigrants | Sudan
50.0
/100
|
#174
Average
10.9%
Creek
49.6
/100
|
#175
Average
10.9%
Immigrants | Malaysia
47.9
/100
|
#176
Average
11.0%
Cherokee
47.3
/100
|
#177
Average
11.0%
German Russians
46.9
/100
|
#178
Average
11.0%
Immigrants | Northern Africa
44.6
/100
|
#179
Average
11.0%
Immigrants | Thailand
43.5
/100
|
#180
Average
11.0%
Immigrants | Eastern Africa
43.4
/100
|
#181
Average
11.0%
Immigrants | Fiji
42.0
/100
|
#182
Average
11.0%

Demographics Similar to Burmese by Seniors Poverty Over the Age of 65

In terms of seniors poverty over the age of 65, the demographic groups most similar to Burmese are Romanian (10.1%, a difference of 0.020%), Immigrants from Afghanistan (10.1%, a difference of 0.040%), Immigrants from Nepal (10.1%, a difference of 0.040%), Jordanian (10.1%, a difference of 0.050%), and Immigrants from Poland (10.1%, a difference of 0.060%).
DemographicsRating | RankSeniors Poverty Over the Age of 65
Koreans
97.4
/100
|
#80
Exceptional
10.1%
Immigrants | Sri Lanka
97.3
/100
|
#81
Exceptional
10.1%
Immigrants | Bolivia
97.3
/100
|
#82
Exceptional
10.1%
Immigrants | Poland
97.2
/100
|
#83
Exceptional
10.1%
Immigrants | Afghanistan
97.2
/100
|
#84
Exceptional
10.1%
Immigrants | Nepal
97.2
/100
|
#85
Exceptional
10.1%
Romanians
97.2
/100
|
#86
Exceptional
10.1%
Burmese
97.2
/100
|
#87
Exceptional
10.1%
Jordanians
97.1
/100
|
#88
Exceptional
10.1%
Immigrants | Bulgaria
97.0
/100
|
#89
Exceptional
10.1%
Ukrainians
96.9
/100
|
#90
Exceptional
10.1%
Puget Sound Salish
96.9
/100
|
#91
Exceptional
10.1%
Immigrants | Singapore
96.9
/100
|
#92
Exceptional
10.1%
Immigrants | Sweden
96.7
/100
|
#93
Exceptional
10.1%
Immigrants | Germany
96.7
/100
|
#94
Exceptional
10.1%