Cree vs Spaniard Child Poverty Among Boys Under 16
COMPARE
Cree
Spaniard
Child Poverty Among Boys Under 16
Child Poverty Among Boys Under 16 Comparison
Cree
Spaniards
19.0%
CHILD POVERTY AMONG BOYS UNDER 16
0.4/ 100
METRIC RATING
245th/ 347
METRIC RANK
17.1%
CHILD POVERTY AMONG BOYS UNDER 16
20.5/ 100
METRIC RATING
196th/ 347
METRIC RANK
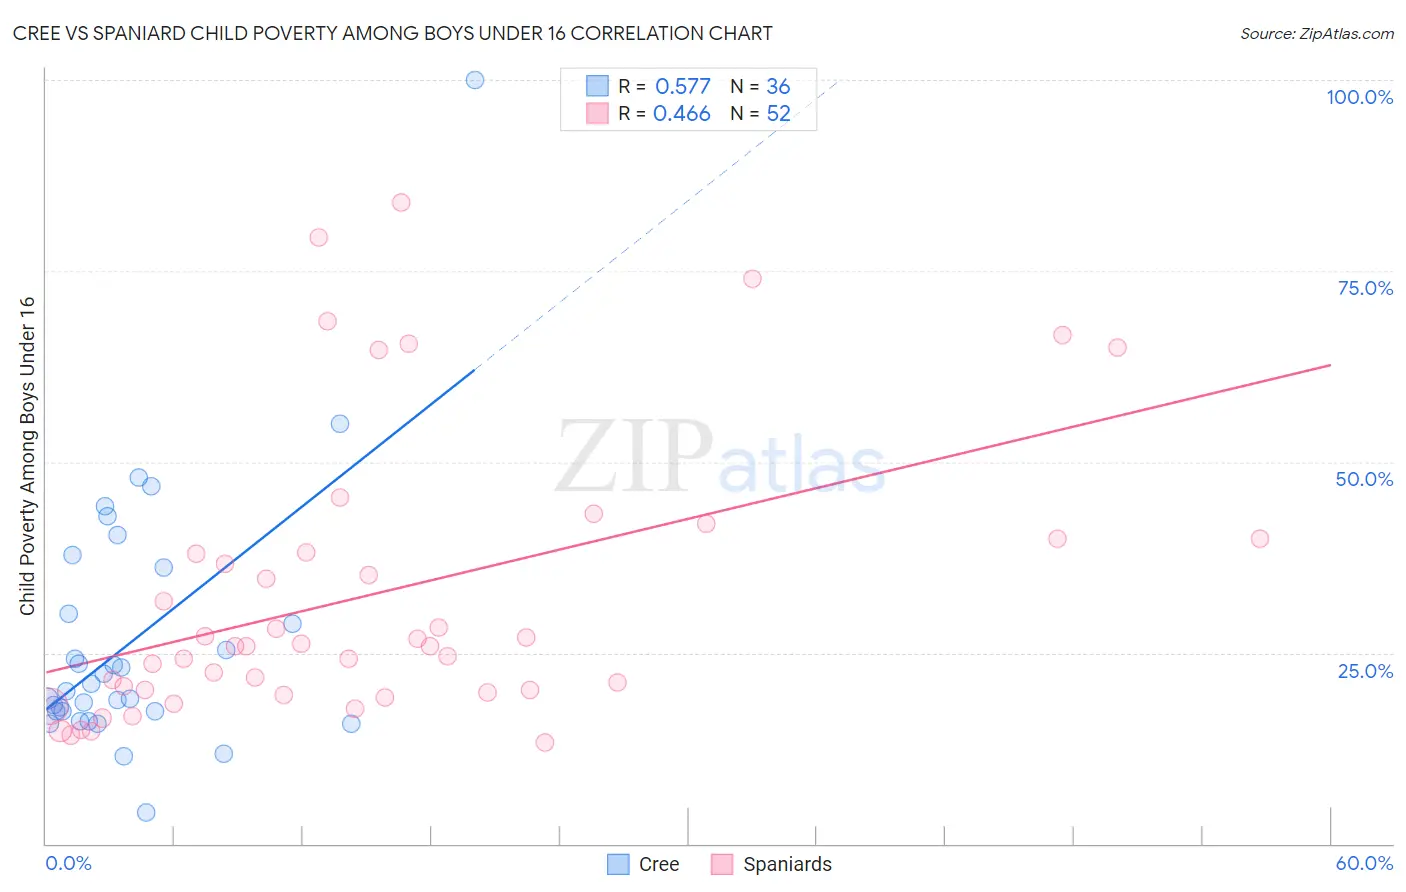
Cree vs Spaniard Child Poverty Among Boys Under 16 Correlation Chart
The statistical analysis conducted on geographies consisting of 75,900,369 people shows a substantial positive correlation between the proportion of Cree and poverty level among boys under the age of 16 in the United States with a correlation coefficient (R) of 0.577 and weighted average of 19.0%. Similarly, the statistical analysis conducted on geographies consisting of 435,078,567 people shows a moderate positive correlation between the proportion of Spaniards and poverty level among boys under the age of 16 in the United States with a correlation coefficient (R) of 0.466 and weighted average of 17.1%, a difference of 11.2%.
Child Poverty Among Boys Under 16 Correlation Summary
| Measurement | Cree | Spaniard |
| Minimum | 4.1% | 13.2% |
| Maximum | 100.0% | 83.9% |
| Range | 95.9% | 70.7% |
| Mean | 26.7% | 32.6% |
| Median | 20.4% | 25.9% |
| Interquartile 25% (IQ1) | 17.3% | 19.9% |
| Interquartile 75% (IQ3) | 33.1% | 39.1% |
| Interquartile Range (IQR) | 15.8% | 19.2% |
| Standard Deviation (Sample) | 17.2% | 18.6% |
| Standard Deviation (Population) | 17.0% | 18.4% |
Similar Demographics by Child Poverty Among Boys Under 16
Demographics Similar to Cree by Child Poverty Among Boys Under 16
In terms of child poverty among boys under 16, the demographic groups most similar to Cree are Immigrants from Middle Africa (18.9%, a difference of 0.13%), Immigrants from the Azores (18.9%, a difference of 0.14%), Immigrants from Nicaragua (19.0%, a difference of 0.20%), Immigrants from Trinidad and Tobago (19.0%, a difference of 0.32%), and Salvadoran (19.0%, a difference of 0.40%).
| Demographics | Rating | Rank | Child Poverty Among Boys Under 16 |
| Immigrants | Laos | 0.8 /100 | #238 | Tragic 18.7% |
| Cape Verdeans | 0.7 /100 | #239 | Tragic 18.7% |
| Immigrants | Cuba | 0.6 /100 | #240 | Tragic 18.8% |
| Immigrants | Sudan | 0.6 /100 | #241 | Tragic 18.8% |
| Ghanaians | 0.5 /100 | #242 | Tragic 18.9% |
| Immigrants | Azores | 0.4 /100 | #243 | Tragic 18.9% |
| Immigrants | Middle Africa | 0.4 /100 | #244 | Tragic 18.9% |
| Cree | 0.4 /100 | #245 | Tragic 19.0% |
| Immigrants | Nicaragua | 0.4 /100 | #246 | Tragic 19.0% |
| Immigrants | Trinidad and Tobago | 0.3 /100 | #247 | Tragic 19.0% |
| Salvadorans | 0.3 /100 | #248 | Tragic 19.0% |
| Alsatians | 0.3 /100 | #249 | Tragic 19.1% |
| Immigrants | Burma/Myanmar | 0.2 /100 | #250 | Tragic 19.2% |
| French American Indians | 0.2 /100 | #251 | Tragic 19.2% |
| Immigrants | Western Africa | 0.2 /100 | #252 | Tragic 19.3% |
Demographics Similar to Spaniards by Child Poverty Among Boys Under 16
In terms of child poverty among boys under 16, the demographic groups most similar to Spaniards are Spanish (17.0%, a difference of 0.040%), Immigrants from Kenya (17.1%, a difference of 0.060%), Immigrants from Lebanon (17.0%, a difference of 0.12%), Immigrants from Uganda (17.0%, a difference of 0.18%), and Immigrants from Iraq (17.0%, a difference of 0.18%).
| Demographics | Rating | Rank | Child Poverty Among Boys Under 16 |
| Immigrants | Morocco | 34.5 /100 | #189 | Fair 16.7% |
| Arabs | 31.1 /100 | #190 | Fair 16.8% |
| Alaska Natives | 29.8 /100 | #191 | Fair 16.8% |
| Immigrants | Uganda | 21.6 /100 | #192 | Fair 17.0% |
| Immigrants | Iraq | 21.6 /100 | #193 | Fair 17.0% |
| Immigrants | Lebanon | 21.2 /100 | #194 | Fair 17.0% |
| Spanish | 20.8 /100 | #195 | Fair 17.0% |
| Spaniards | 20.5 /100 | #196 | Fair 17.1% |
| Immigrants | Kenya | 20.1 /100 | #197 | Fair 17.1% |
| Immigrants | Cameroon | 19.0 /100 | #198 | Poor 17.1% |
| Delaware | 18.8 /100 | #199 | Poor 17.1% |
| Immigrants | Uruguay | 16.9 /100 | #200 | Poor 17.2% |
| Immigrants | Afghanistan | 13.7 /100 | #201 | Poor 17.3% |
| Immigrants | Sierra Leone | 13.4 /100 | #202 | Poor 17.3% |
| Immigrants | Uzbekistan | 13.3 /100 | #203 | Poor 17.3% |