Cree vs Scandinavian Male Poverty
COMPARE
Cree
Scandinavian
Male Poverty
Male Poverty Comparison
Cree
Scandinavians
13.3%
MALE POVERTY
0.0/ 100
METRIC RATING
270th/ 347
METRIC RANK
10.1%
MALE POVERTY
98.0/ 100
METRIC RATING
58th/ 347
METRIC RANK
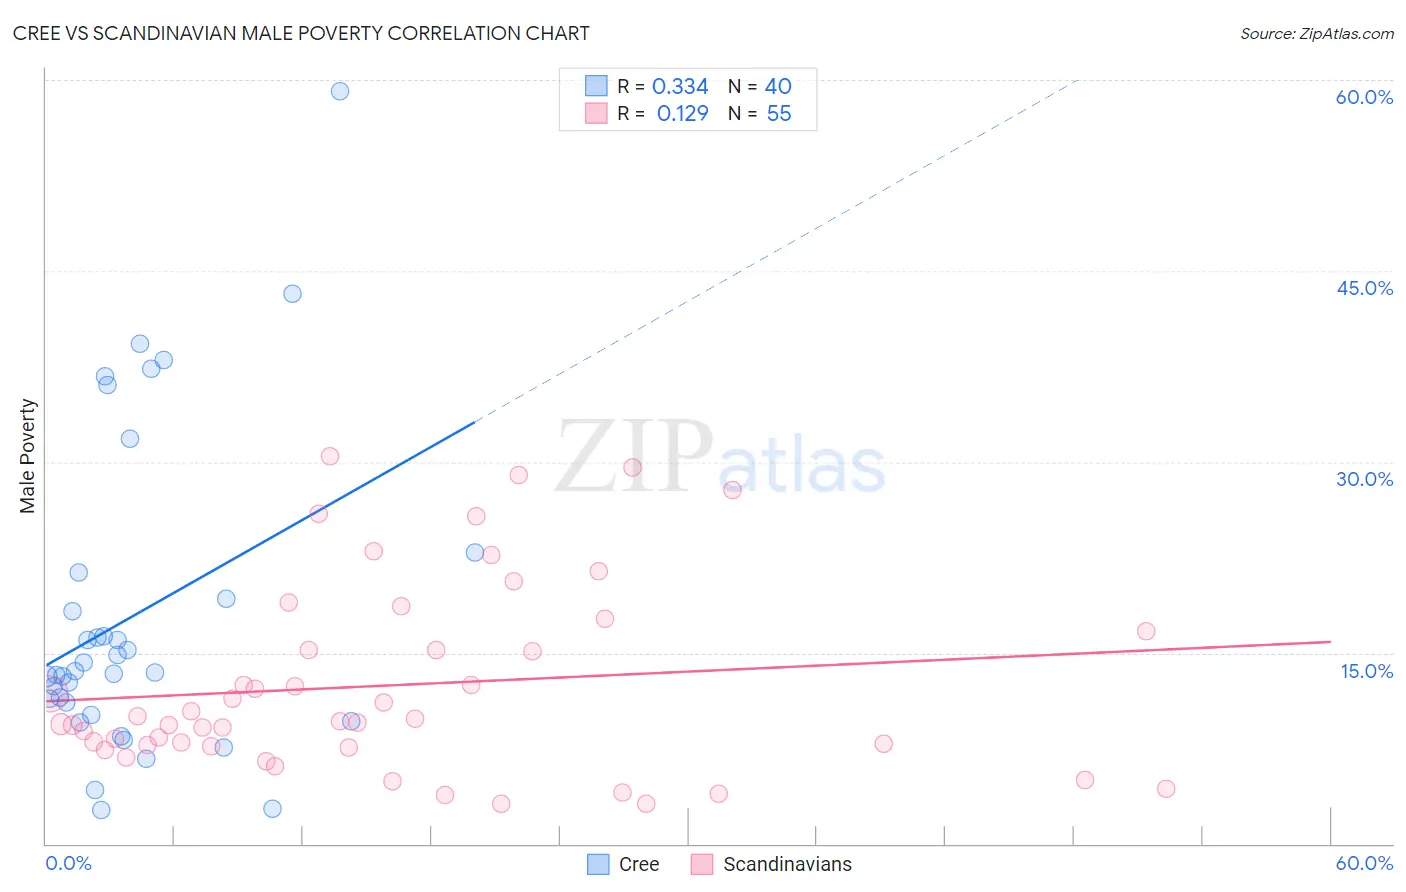
Cree vs Scandinavian Male Poverty Correlation Chart
The statistical analysis conducted on geographies consisting of 76,204,291 people shows a mild positive correlation between the proportion of Cree and poverty level among males in the United States with a correlation coefficient (R) of 0.334 and weighted average of 13.3%. Similarly, the statistical analysis conducted on geographies consisting of 471,949,294 people shows a poor positive correlation between the proportion of Scandinavians and poverty level among males in the United States with a correlation coefficient (R) of 0.129 and weighted average of 10.1%, a difference of 31.9%.
Male Poverty Correlation Summary
| Measurement | Cree | Scandinavian |
| Minimum | 2.7% | 3.2% |
| Maximum | 59.1% | 30.5% |
| Range | 56.4% | 27.3% |
| Mean | 18.0% | 12.4% |
| Median | 13.5% | 9.6% |
| Interquartile 25% (IQ1) | 10.6% | 7.6% |
| Interquartile 75% (IQ3) | 20.2% | 16.7% |
| Interquartile Range (IQR) | 9.6% | 9.0% |
| Standard Deviation (Sample) | 12.5% | 7.4% |
| Standard Deviation (Population) | 12.4% | 7.3% |
Similar Demographics by Male Poverty
Demographics Similar to Cree by Male Poverty
In terms of male poverty, the demographic groups most similar to Cree are Spanish American (13.4%, a difference of 0.030%), Guyanese (13.3%, a difference of 0.47%), Subsaharan African (13.3%, a difference of 0.69%), Immigrants from Jamaica (13.3%, a difference of 0.72%), and Immigrants from Bahamas (13.5%, a difference of 0.78%).
| Demographics | Rating | Rank | Male Poverty |
| Central Americans | 0.1 /100 | #263 | Tragic 13.2% |
| Iroquois | 0.1 /100 | #264 | Tragic 13.2% |
| Jamaicans | 0.1 /100 | #265 | Tragic 13.2% |
| Immigrants | Guyana | 0.1 /100 | #266 | Tragic 13.2% |
| Immigrants | Jamaica | 0.1 /100 | #267 | Tragic 13.3% |
| Sub-Saharan Africans | 0.1 /100 | #268 | Tragic 13.3% |
| Guyanese | 0.0 /100 | #269 | Tragic 13.3% |
| Cree | 0.0 /100 | #270 | Tragic 13.3% |
| Spanish Americans | 0.0 /100 | #271 | Tragic 13.4% |
| Immigrants | Bahamas | 0.0 /100 | #272 | Tragic 13.5% |
| Chickasaw | 0.0 /100 | #273 | Tragic 13.5% |
| Immigrants | West Indies | 0.0 /100 | #274 | Tragic 13.5% |
| Barbadians | 0.0 /100 | #275 | Tragic 13.6% |
| Immigrants | Latin America | 0.0 /100 | #276 | Tragic 13.6% |
| Bangladeshis | 0.0 /100 | #277 | Tragic 13.6% |
Demographics Similar to Scandinavians by Male Poverty
In terms of male poverty, the demographic groups most similar to Scandinavians are Estonian (10.1%, a difference of 0.070%), Immigrants from Europe (10.1%, a difference of 0.13%), Immigrants from Bulgaria (10.1%, a difference of 0.22%), Ukrainian (10.1%, a difference of 0.22%), and Austrian (10.1%, a difference of 0.24%).
| Demographics | Rating | Rank | Male Poverty |
| Immigrants | Croatia | 98.7 /100 | #51 | Exceptional 10.0% |
| Asians | 98.7 /100 | #52 | Exceptional 10.0% |
| Immigrants | Czechoslovakia | 98.6 /100 | #53 | Exceptional 10.0% |
| Immigrants | Austria | 98.5 /100 | #54 | Exceptional 10.0% |
| Germans | 98.3 /100 | #55 | Exceptional 10.1% |
| Immigrants | Bulgaria | 98.2 /100 | #56 | Exceptional 10.1% |
| Estonians | 98.1 /100 | #57 | Exceptional 10.1% |
| Scandinavians | 98.0 /100 | #58 | Exceptional 10.1% |
| Immigrants | Europe | 97.9 /100 | #59 | Exceptional 10.1% |
| Ukrainians | 97.9 /100 | #60 | Exceptional 10.1% |
| Austrians | 97.8 /100 | #61 | Exceptional 10.1% |
| Immigrants | Italy | 97.8 /100 | #62 | Exceptional 10.2% |
| Slovaks | 97.7 /100 | #63 | Exceptional 10.2% |
| Swiss | 97.5 /100 | #64 | Exceptional 10.2% |
| Zimbabweans | 97.5 /100 | #65 | Exceptional 10.2% |