Cree vs Immigrants from Laos Female Poverty Among 25-34 Year Olds
COMPARE
Cree
Immigrants from Laos
Female Poverty Among 25-34 Year Olds
Female Poverty Among 25-34 Year Olds Comparison
Cree
Immigrants from Laos
15.6%
FEMALE POVERTY AMONG 25-34 YEAR OLDS
0.1/ 100
METRIC RATING
271st/ 347
METRIC RANK
15.2%
FEMALE POVERTY AMONG 25-34 YEAR OLDS
0.3/ 100
METRIC RATING
255th/ 347
METRIC RANK
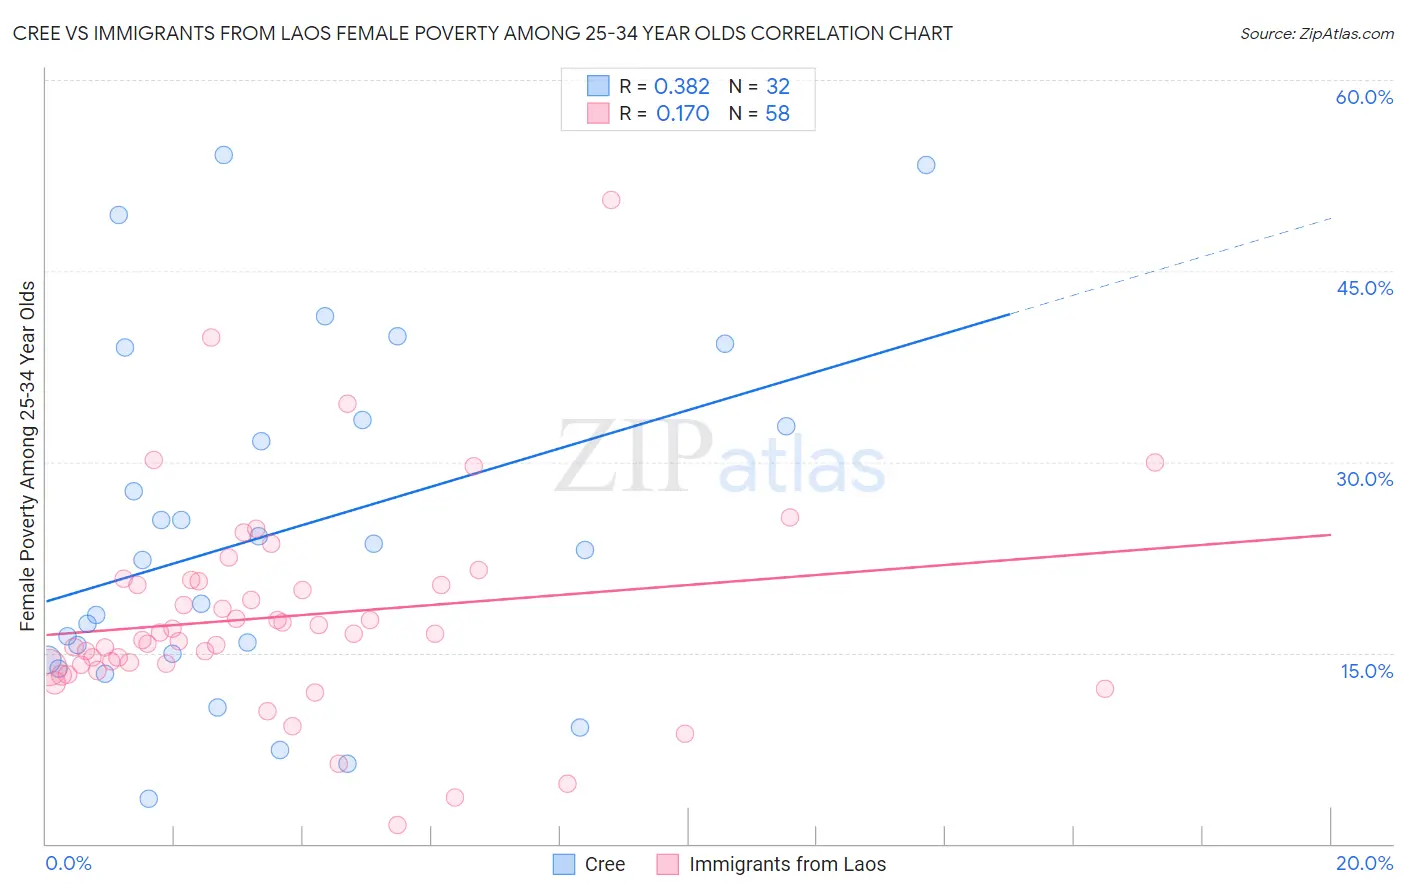
Cree vs Immigrants from Laos Female Poverty Among 25-34 Year Olds Correlation Chart
The statistical analysis conducted on geographies consisting of 75,962,036 people shows a mild positive correlation between the proportion of Cree and poverty level among females between the ages 25 and 34 in the United States with a correlation coefficient (R) of 0.382 and weighted average of 15.6%. Similarly, the statistical analysis conducted on geographies consisting of 200,030,189 people shows a poor positive correlation between the proportion of Immigrants from Laos and poverty level among females between the ages 25 and 34 in the United States with a correlation coefficient (R) of 0.170 and weighted average of 15.2%, a difference of 3.0%.
Female Poverty Among 25-34 Year Olds Correlation Summary
| Measurement | Cree | Immigrants from Laos |
| Minimum | 3.5% | 1.5% |
| Maximum | 54.1% | 50.6% |
| Range | 50.6% | 49.1% |
| Mean | 24.4% | 17.9% |
| Median | 22.7% | 16.5% |
| Interquartile 25% (IQ1) | 14.7% | 14.1% |
| Interquartile 75% (IQ3) | 33.1% | 20.6% |
| Interquartile Range (IQR) | 18.4% | 6.5% |
| Standard Deviation (Sample) | 13.7% | 8.2% |
| Standard Deviation (Population) | 13.4% | 8.1% |
Demographics Similar to Cree and Immigrants from Laos by Female Poverty Among 25-34 Year Olds
In terms of female poverty among 25-34 year olds, the demographic groups most similar to Cree are British West Indian (15.6%, a difference of 0.010%), Senegalese (15.6%, a difference of 0.060%), Subsaharan African (15.6%, a difference of 0.16%), Nonimmigrants (15.6%, a difference of 0.17%), and Immigrants from Senegal (15.6%, a difference of 0.37%). Similarly, the demographic groups most similar to Immigrants from Laos are West Indian (15.2%, a difference of 0.17%), Immigrants from Burma/Myanmar (15.2%, a difference of 0.19%), Somali (15.1%, a difference of 0.39%), Nepalese (15.2%, a difference of 0.45%), and Immigrants from West Indies (15.1%, a difference of 0.47%).
| Demographics | Rating | Rank | Female Poverty Among 25-34 Year Olds |
| Immigrants | West Indies | 0.4 /100 | #253 | Tragic 15.1% |
| Somalis | 0.4 /100 | #254 | Tragic 15.1% |
| Immigrants | Laos | 0.3 /100 | #255 | Tragic 15.2% |
| West Indians | 0.3 /100 | #256 | Tragic 15.2% |
| Immigrants | Burma/Myanmar | 0.3 /100 | #257 | Tragic 15.2% |
| Nepalese | 0.2 /100 | #258 | Tragic 15.2% |
| Immigrants | Cuba | 0.2 /100 | #259 | Tragic 15.2% |
| Marshallese | 0.2 /100 | #260 | Tragic 15.3% |
| Liberians | 0.2 /100 | #261 | Tragic 15.3% |
| Immigrants | Belize | 0.2 /100 | #262 | Tragic 15.3% |
| Mexican American Indians | 0.2 /100 | #263 | Tragic 15.4% |
| Pennsylvania Germans | 0.1 /100 | #264 | Tragic 15.4% |
| Immigrants | Liberia | 0.1 /100 | #265 | Tragic 15.4% |
| Immigrants | Somalia | 0.1 /100 | #266 | Tragic 15.4% |
| Central Americans | 0.1 /100 | #267 | Tragic 15.5% |
| Immigrants | Senegal | 0.1 /100 | #268 | Tragic 15.6% |
| Sub-Saharan Africans | 0.1 /100 | #269 | Tragic 15.6% |
| British West Indians | 0.1 /100 | #270 | Tragic 15.6% |
| Cree | 0.1 /100 | #271 | Tragic 15.6% |
| Senegalese | 0.1 /100 | #272 | Tragic 15.6% |
| Immigrants | Nonimmigrants | 0.1 /100 | #273 | Tragic 15.6% |