Cree vs Chinese Female Poverty Among 18-24 Year Olds
COMPARE
Cree
Chinese
Female Poverty Among 18-24 Year Olds
Female Poverty Among 18-24 Year Olds Comparison
Cree
Chinese
23.4%
FEMALE POVERTY AMONG 18-24 YEAR OLDS
0.0/ 100
METRIC RATING
307th/ 347
METRIC RANK
16.2%
FEMALE POVERTY AMONG 18-24 YEAR OLDS
100.0/ 100
METRIC RATING
2nd/ 347
METRIC RANK
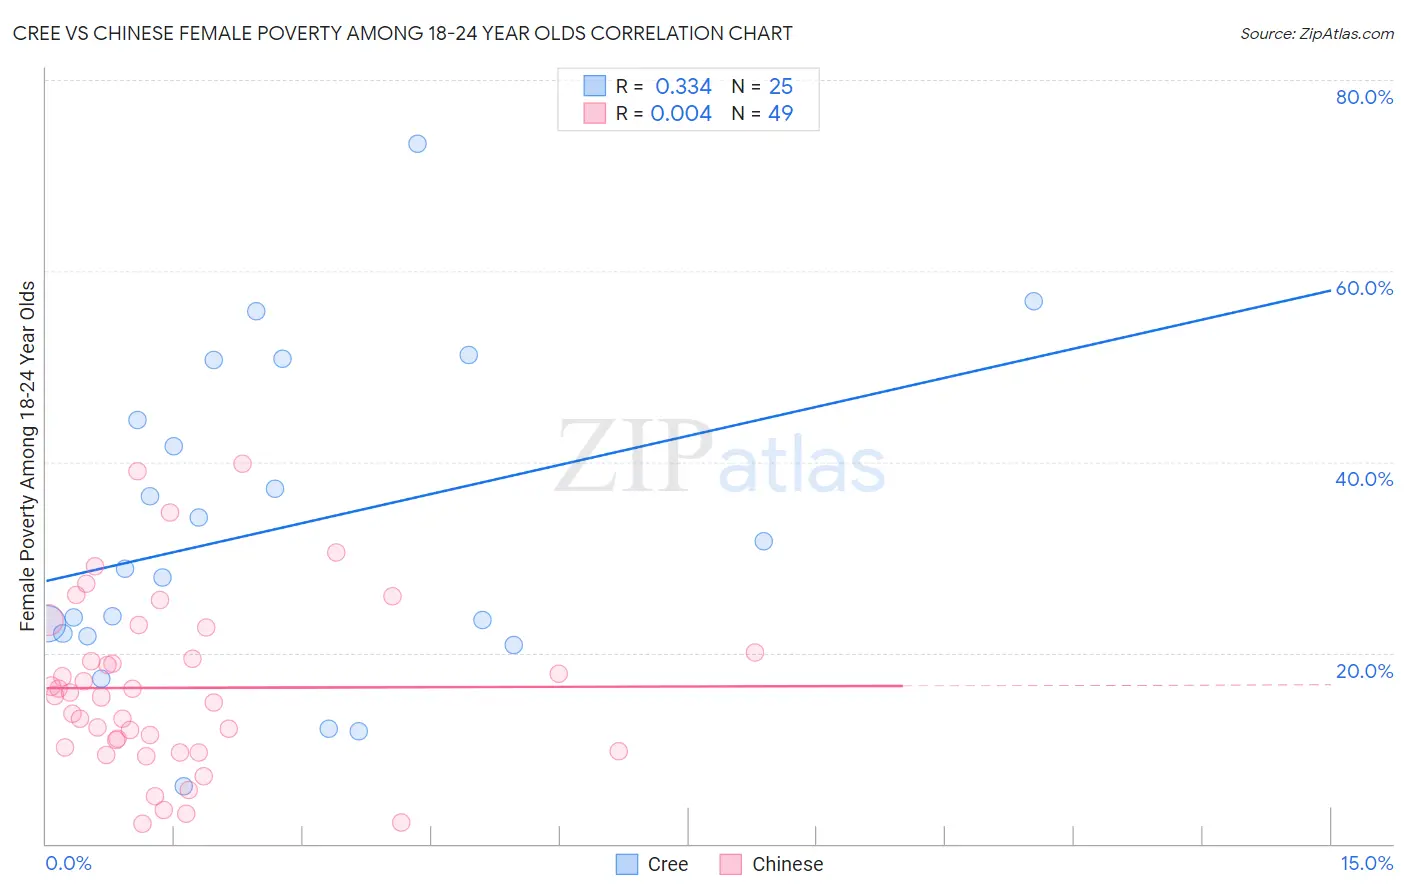
Cree vs Chinese Female Poverty Among 18-24 Year Olds Correlation Chart
The statistical analysis conducted on geographies consisting of 75,651,650 people shows a mild positive correlation between the proportion of Cree and poverty level among females between the ages 18 and 24 in the United States with a correlation coefficient (R) of 0.334 and weighted average of 23.4%. Similarly, the statistical analysis conducted on geographies consisting of 64,601,835 people shows no correlation between the proportion of Chinese and poverty level among females between the ages 18 and 24 in the United States with a correlation coefficient (R) of 0.004 and weighted average of 16.2%, a difference of 45.0%.
Female Poverty Among 18-24 Year Olds Correlation Summary
| Measurement | Cree | Chinese |
| Minimum | 6.0% | 2.1% |
| Maximum | 73.3% | 39.8% |
| Range | 67.3% | 37.7% |
| Mean | 33.1% | 16.3% |
| Median | 28.9% | 15.5% |
| Interquartile 25% (IQ1) | 21.9% | 9.9% |
| Interquartile 75% (IQ3) | 47.5% | 21.3% |
| Interquartile Range (IQR) | 25.6% | 11.5% |
| Standard Deviation (Sample) | 16.6% | 9.0% |
| Standard Deviation (Population) | 16.2% | 8.9% |
Similar Demographics by Female Poverty Among 18-24 Year Olds
Demographics Similar to Cree by Female Poverty Among 18-24 Year Olds
In terms of female poverty among 18-24 year olds, the demographic groups most similar to Cree are Immigrants from Sudan (23.5%, a difference of 0.35%), Paiute (23.3%, a difference of 0.59%), Blackfeet (23.6%, a difference of 0.80%), Comanche (23.6%, a difference of 0.85%), and Potawatomi (23.7%, a difference of 1.1%).
| Demographics | Rating | Rank | Female Poverty Among 18-24 Year Olds |
| Africans | 0.0 /100 | #300 | Tragic 22.8% |
| Seminole | 0.0 /100 | #301 | Tragic 22.9% |
| Iroquois | 0.0 /100 | #302 | Tragic 22.9% |
| Senegalese | 0.0 /100 | #303 | Tragic 23.0% |
| Sudanese | 0.0 /100 | #304 | Tragic 23.0% |
| Immigrants | Kuwait | 0.0 /100 | #305 | Tragic 23.0% |
| Paiute | 0.0 /100 | #306 | Tragic 23.3% |
| Cree | 0.0 /100 | #307 | Tragic 23.4% |
| Immigrants | Sudan | 0.0 /100 | #308 | Tragic 23.5% |
| Blackfeet | 0.0 /100 | #309 | Tragic 23.6% |
| Comanche | 0.0 /100 | #310 | Tragic 23.6% |
| Potawatomi | 0.0 /100 | #311 | Tragic 23.7% |
| Yuman | 0.0 /100 | #312 | Tragic 24.0% |
| Creek | 0.0 /100 | #313 | Tragic 24.2% |
| Choctaw | 0.0 /100 | #314 | Tragic 24.3% |
Demographics Similar to Chinese by Female Poverty Among 18-24 Year Olds
In terms of female poverty among 18-24 year olds, the demographic groups most similar to Chinese are Immigrants from Cuba (16.4%, a difference of 1.7%), Immigrants from India (16.4%, a difference of 1.7%), Immigrants from Portugal (16.5%, a difference of 2.4%), Immigrants from Philippines (16.7%, a difference of 3.2%), and Immigrants from the Azores (16.7%, a difference of 3.3%).
| Demographics | Rating | Rank | Female Poverty Among 18-24 Year Olds |
| Assyrians/Chaldeans/Syriacs | 100.0 /100 | #1 | Exceptional 13.7% |
| Chinese | 100.0 /100 | #2 | Exceptional 16.2% |
| Immigrants | Cuba | 100.0 /100 | #3 | Exceptional 16.4% |
| Immigrants | India | 100.0 /100 | #4 | Exceptional 16.4% |
| Immigrants | Portugal | 100.0 /100 | #5 | Exceptional 16.5% |
| Immigrants | Philippines | 100.0 /100 | #6 | Exceptional 16.7% |
| Immigrants | Azores | 100.0 /100 | #7 | Exceptional 16.7% |
| Immigrants | Bolivia | 100.0 /100 | #8 | Exceptional 16.7% |
| Immigrants | Peru | 100.0 /100 | #9 | Exceptional 16.9% |
| Koreans | 100.0 /100 | #10 | Exceptional 16.9% |
| Thais | 100.0 /100 | #11 | Exceptional 17.0% |
| Immigrants | Pakistan | 100.0 /100 | #12 | Exceptional 17.0% |
| Immigrants | Poland | 100.0 /100 | #13 | Exceptional 17.1% |
| Tongans | 100.0 /100 | #14 | Exceptional 17.1% |
| Cubans | 100.0 /100 | #15 | Exceptional 17.2% |