Costa Rican vs Sri Lankan Child Poverty Among Girls Under 16
COMPARE
Costa Rican
Sri Lankan
Child Poverty Among Girls Under 16
Child Poverty Among Girls Under 16 Comparison
Costa Ricans
Sri Lankans
16.2%
CHILD POVERTY AMONG GIRLS UNDER 16
64.2/ 100
METRIC RATING
169th/ 347
METRIC RANK
15.2%
CHILD POVERTY AMONG GIRLS UNDER 16
94.0/ 100
METRIC RATING
114th/ 347
METRIC RANK
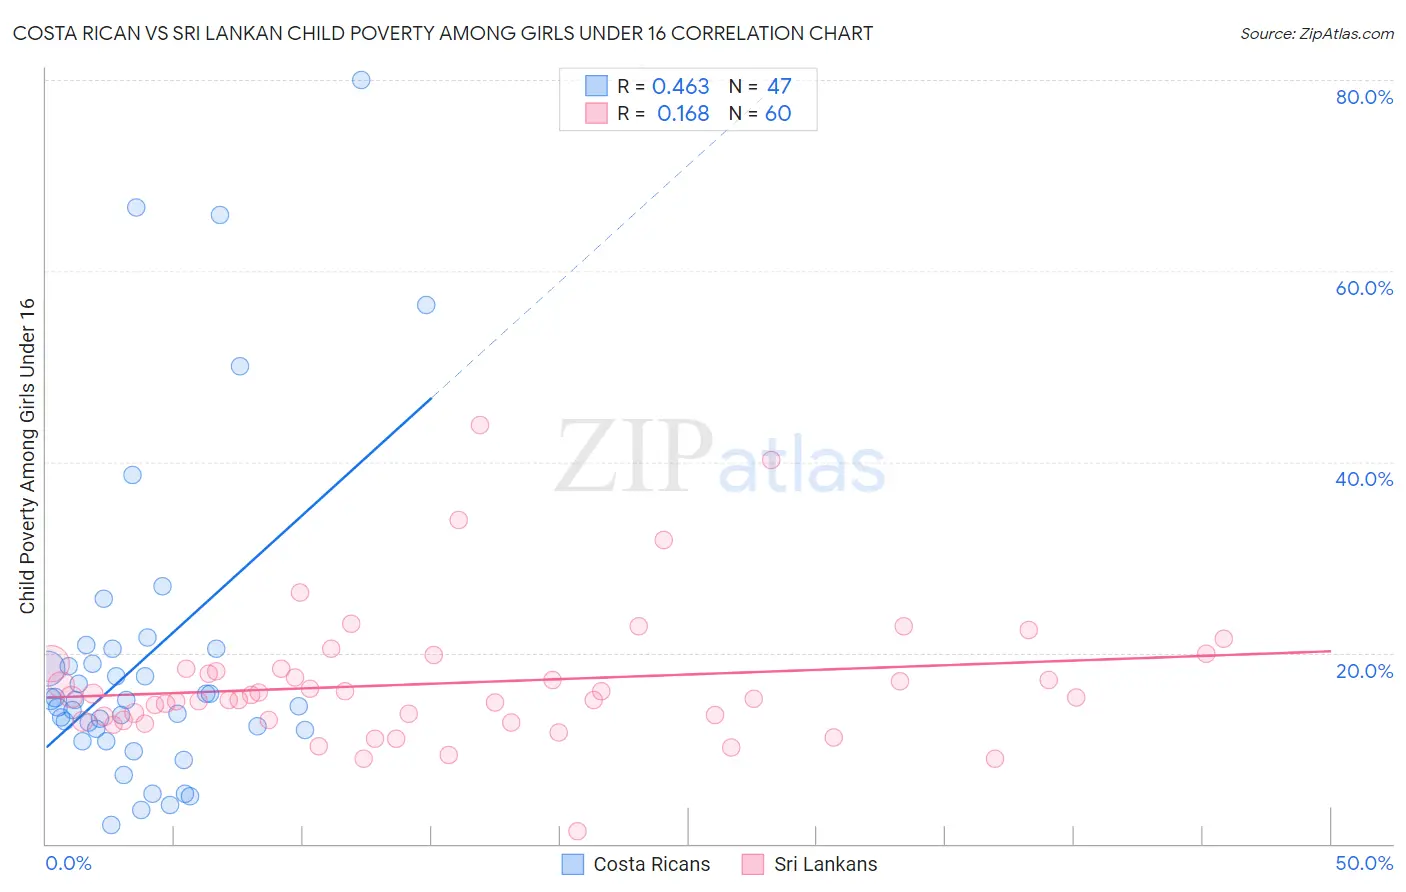
Costa Rican vs Sri Lankan Child Poverty Among Girls Under 16 Correlation Chart
The statistical analysis conducted on geographies consisting of 251,202,107 people shows a moderate positive correlation between the proportion of Costa Ricans and poverty level among girls under the age of 16 in the United States with a correlation coefficient (R) of 0.463 and weighted average of 16.2%. Similarly, the statistical analysis conducted on geographies consisting of 432,135,013 people shows a poor positive correlation between the proportion of Sri Lankans and poverty level among girls under the age of 16 in the United States with a correlation coefficient (R) of 0.168 and weighted average of 15.2%, a difference of 6.8%.
Child Poverty Among Girls Under 16 Correlation Summary
| Measurement | Costa Rican | Sri Lankan |
| Minimum | 2.0% | 1.3% |
| Maximum | 80.0% | 43.9% |
| Range | 78.0% | 42.6% |
| Mean | 19.6% | 16.8% |
| Median | 15.0% | 15.3% |
| Interquartile 25% (IQ1) | 11.9% | 12.9% |
| Interquartile 75% (IQ3) | 20.4% | 18.4% |
| Interquartile Range (IQR) | 8.5% | 5.4% |
| Standard Deviation (Sample) | 17.0% | 7.0% |
| Standard Deviation (Population) | 16.8% | 7.0% |
Similar Demographics by Child Poverty Among Girls Under 16
Demographics Similar to Costa Ricans by Child Poverty Among Girls Under 16
In terms of child poverty among girls under 16, the demographic groups most similar to Costa Ricans are Immigrants from Venezuela (16.2%, a difference of 0.0%), Yugoslavian (16.2%, a difference of 0.010%), Immigrants from Saudi Arabia (16.2%, a difference of 0.030%), Uruguayan (16.2%, a difference of 0.060%), and Afghan (16.2%, a difference of 0.24%).
| Demographics | Rating | Rank | Child Poverty Among Girls Under 16 |
| French Canadians | 68.7 /100 | #162 | Good 16.1% |
| Immigrants | Oceania | 68.4 /100 | #163 | Good 16.1% |
| Immigrants | Colombia | 67.8 /100 | #164 | Good 16.1% |
| Immigrants | Germany | 67.3 /100 | #165 | Good 16.1% |
| South Americans | 67.2 /100 | #166 | Good 16.1% |
| Uruguayans | 64.7 /100 | #167 | Good 16.2% |
| Yugoslavians | 64.4 /100 | #168 | Good 16.2% |
| Costa Ricans | 64.2 /100 | #169 | Good 16.2% |
| Immigrants | Venezuela | 64.2 /100 | #170 | Good 16.2% |
| Immigrants | Saudi Arabia | 64.0 /100 | #171 | Good 16.2% |
| Afghans | 62.3 /100 | #172 | Good 16.2% |
| Immigrants | South America | 55.1 /100 | #173 | Average 16.4% |
| Ethiopians | 50.0 /100 | #174 | Average 16.5% |
| Lebanese | 45.4 /100 | #175 | Average 16.6% |
| Hungarians | 45.1 /100 | #176 | Average 16.6% |
Demographics Similar to Sri Lankans by Child Poverty Among Girls Under 16
In terms of child poverty among girls under 16, the demographic groups most similar to Sri Lankans are Belgian (15.2%, a difference of 0.060%), Dutch (15.1%, a difference of 0.13%), Immigrants from Kazakhstan (15.1%, a difference of 0.15%), Palestinian (15.1%, a difference of 0.29%), and Immigrants from Croatia (15.1%, a difference of 0.34%).
| Demographics | Rating | Rank | Child Poverty Among Girls Under 16 |
| Immigrants | Ukraine | 95.0 /100 | #107 | Exceptional 15.1% |
| Immigrants | Brazil | 94.9 /100 | #108 | Exceptional 15.1% |
| Serbians | 94.8 /100 | #109 | Exceptional 15.1% |
| Immigrants | Croatia | 94.6 /100 | #110 | Exceptional 15.1% |
| Palestinians | 94.5 /100 | #111 | Exceptional 15.1% |
| Immigrants | Kazakhstan | 94.3 /100 | #112 | Exceptional 15.1% |
| Dutch | 94.3 /100 | #113 | Exceptional 15.1% |
| Sri Lankans | 94.0 /100 | #114 | Exceptional 15.2% |
| Belgians | 93.9 /100 | #115 | Exceptional 15.2% |
| Immigrants | Denmark | 93.3 /100 | #116 | Exceptional 15.2% |
| Immigrants | North Macedonia | 93.1 /100 | #117 | Exceptional 15.2% |
| Immigrants | Southern Europe | 92.7 /100 | #118 | Exceptional 15.3% |
| Immigrants | Zimbabwe | 92.5 /100 | #119 | Exceptional 15.3% |
| Pakistanis | 92.3 /100 | #120 | Exceptional 15.3% |
| English | 92.2 /100 | #121 | Exceptional 15.3% |