Costa Rican vs Iranian Seniors Poverty Over the Age of 65

COMPARE

Costa Rican
Race
Ancestry
AfghanAfricanAlaska NativeAlaskan AthabascanAlbanianAleutAlsatianAmericanApacheArabArapahoArgentineanArmenianAssyrian/Chaldean/SyriacAustralianAustrianBahamianBangladeshiBarbadianBasqueBelgianBelizeanBermudanBhutaneseBlackfeetBolivianBrazilianBritishBritish West IndianBulgarianBurmeseCajunCambodianCanadianCape VerdeanCarpatho RusynCelticCentral AmericanCentral American IndianCherokeeCheyenneChickasawChileanChineseChippewaChoctawColombianColvilleComancheCosta RicanCreeCreekCroatianCrowCubanCypriotCzechCzechoslovakianDanishDelawareDominicanDutchDutch West IndianEastern EuropeanEcuadorianEgyptianEnglishEstonianEthiopianEuropeanFijianFilipinoFinnishFrenchFrench American IndianFrench CanadianGermanGerman RussianGhanaianGreekGuamanian/ChamorroGuatemalanGuyaneseHaitianHmongHonduranHopiHoumaHungarianIcelanderIndian (Asian)IndonesianInupiatIraqiIrishIroquoisIsraeliItalianJamaicanJapaneseJordanianKenyanKiowaKoreanLaotianLatvianLebaneseLiberianLithuanianLumbeeLuxembourgerMacedonianMalaysianMalteseMarshalleseMenomineeMexicanMexican American IndianMongolianMoroccanNative HawaiianNavajoNepaleseNew ZealanderNicaraguanNigerianNorthern EuropeanNorwegianOkinawanOsageOttawaPaiutePakistaniPalestinianPanamanianParaguayanPennsylvania GermanPeruvianPimaPolishPortuguesePotawatomiPuebloPuerto RicanPuget Sound SalishRomanianRussianSalvadoranSamoanScandinavianScotch-IrishScottishSeminoleSenegaleseSerbianShoshoneSierra LeoneanSiouxSlavicSlovakSloveneSomaliSouth AfricanSouth AmericanSouth American IndianSoviet UnionSpaniardSpanishSpanish AmericanSpanish American IndianSri LankanSubsaharan AfricanSudaneseSwedishSwissSyrianTaiwaneseThaiTlingit-HaidaTohono O'OdhamTonganTrinidadian and TobagonianTsimshianTurkishU.S. Virgin IslanderUgandanUkrainianUruguayanUteVenezuelanVietnameseWelshWest IndianYakamaYaquiYugoslavianYumanYup'ikZimbabwean
Immigration
NonimmigrantsImmigrantsAfghanistanAfricaAlbaniaArgentinaArmeniaAsiaAustraliaAustriaBahamasBangladeshBarbadosBelarusBelgiumBelizeBoliviaBosnia and HerzegovinaBrazilBulgariaBurma/MyanmarCabo VerdeCambodiaCameroonCanadaCaribbeanCentral AmericaChileChinaColombiaCongoCosta RicaCroatiaCubaCzechoslovakiaDenmarkDominicaDominican RepublicEastern AfricaEastern AsiaEastern EuropeEcuadorEgyptEl SalvadorEnglandEritreaEthiopiaEuropeFijiFranceGermanyGhanaGreeceGrenadaGuatemalaGuyanaHaitiHondurasHong KongHungaryIndiaIndonesiaIranIraqIrelandIsraelItalyJamaicaJapanJordanKazakhstanKenyaKoreaKuwaitLaosLatin AmericaLatviaLebanonLiberiaLithuaniaMalaysiaMexicoMicronesiaMiddle AfricaMoldovaMoroccoNepalNetherlandsNicaraguaNigeriaNorth AmericaNorth MacedoniaNorthern AfricaNorthern EuropeNorwayOceaniaPakistanPanamaPeruPhilippinesPolandPortugalRomaniaRussiaSaudi ArabiaScotlandSenegalSerbiaSierra LeoneSingaporeSomaliaSouth AfricaSouth AmericaSouth Central AsiaSouth Eastern AsiaSouthern EuropeSpainSri LankaSt. Vincent and the GrenadinesSudanSwedenSwitzerlandSyriaTaiwanThailandTrinidad and TobagoTurkeyUgandaUkraineUruguayUzbekistanVenezuelaVietnamWest IndiesWestern AfricaWestern AsiaWestern EuropeYemenZaireZimbabweAzores
Iranian
Race
Ancestry
AfghanAfricanAlaska NativeAlaskan AthabascanAlbanianAleutAlsatianAmericanApacheArabArapahoArgentineanArmenianAssyrian/Chaldean/SyriacAustralianAustrianBahamianBangladeshiBarbadianBasqueBelgianBelizeanBermudanBhutaneseBlackfeetBolivianBrazilianBritishBritish West IndianBulgarianBurmeseCajunCambodianCanadianCape VerdeanCarpatho RusynCelticCentral AmericanCentral American IndianCherokeeCheyenneChickasawChileanChineseChippewaChoctawColombianColvilleComancheCreeCreekCroatianCrowCubanCypriotCzechCzechoslovakianDanishDelawareDominicanDutchDutch West IndianEastern EuropeanEcuadorianEgyptianEnglishEstonianEthiopianEuropeanFijianFilipinoFinnishFrenchFrench American IndianFrench CanadianGermanGerman RussianGhanaianGreekGuamanian/ChamorroGuatemalanGuyaneseHaitianHmongHonduranHopiHoumaHungarianIcelanderIndian (Asian)IndonesianInupiatIranianIraqiIrishIroquoisIsraeliItalianJamaicanJapaneseJordanianKenyanKiowaKoreanLaotianLatvianLebaneseLiberianLithuanianLumbeeLuxembourgerMacedonianMalaysianMalteseMarshalleseMenomineeMexicanMexican American IndianMongolianMoroccanNative HawaiianNavajoNepaleseNew ZealanderNicaraguanNigerianNorthern EuropeanNorwegianOkinawanOsageOttawaPaiutePakistaniPalestinianPanamanianParaguayanPennsylvania GermanPeruvianPimaPolishPortuguesePotawatomiPuebloPuerto RicanPuget Sound SalishRomanianRussianSalvadoranSamoanScandinavianScotch-IrishScottishSeminoleSenegaleseSerbianShoshoneSierra LeoneanSiouxSlavicSlovakSloveneSomaliSouth AfricanSouth AmericanSouth American IndianSoviet UnionSpaniardSpanishSpanish AmericanSpanish American IndianSri LankanSubsaharan AfricanSudaneseSwedishSwissSyrianTaiwaneseThaiTlingit-HaidaTohono O'OdhamTonganTrinidadian and TobagonianTsimshianTurkishU.S. Virgin IslanderUgandanUkrainianUruguayanUteVenezuelanVietnameseWelshWest IndianYakamaYaquiYugoslavianYumanYup'ikZimbabwean
Immigration
NonimmigrantsImmigrantsAfghanistanAfricaAlbaniaArgentinaArmeniaAsiaAustraliaAustriaBahamasBangladeshBarbadosBelarusBelgiumBelizeBoliviaBosnia and HerzegovinaBrazilBulgariaBurma/MyanmarCabo VerdeCambodiaCameroonCanadaCaribbeanCentral AmericaChileChinaColombiaCongoCosta RicaCroatiaCubaCzechoslovakiaDenmarkDominicaDominican RepublicEastern AfricaEastern AsiaEastern EuropeEcuadorEgyptEl SalvadorEnglandEritreaEthiopiaEuropeFijiFranceGermanyGhanaGreeceGrenadaGuatemalaGuyanaHaitiHondurasHong KongHungaryIndiaIndonesiaIranIraqIrelandIsraelItalyJamaicaJapanJordanKazakhstanKenyaKoreaKuwaitLaosLatin AmericaLatviaLebanonLiberiaLithuaniaMalaysiaMexicoMicronesiaMiddle AfricaMoldovaMoroccoNepalNetherlandsNicaraguaNigeriaNorth AmericaNorth MacedoniaNorthern AfricaNorthern EuropeNorwayOceaniaPakistanPanamaPeruPhilippinesPolandPortugalRomaniaRussiaSaudi ArabiaScotlandSenegalSerbiaSierra LeoneSingaporeSomaliaSouth AfricaSouth AmericaSouth Central AsiaSouth Eastern AsiaSouthern EuropeSpainSri LankaSt. Vincent and the GrenadinesSudanSwedenSwitzerlandSyriaTaiwanThailandTrinidad and TobagoTurkeyUgandaUkraineUruguayUzbekistanVenezuelaVietnamWest IndiesWestern AfricaWestern AsiaWestern EuropeYemenZaireZimbabweAzores
Seniors Poverty Over the Age of 65
Income
Poverty
Unemployment
Labor Participation
Family Structure
Vehicle Availability
Education Level
Disability

Seniors Poverty Over the Age of 65 Comparison

Costa Ricans

Iranians

Poor
Exceptional
11.3%
SENIORS POVERTY OVER THE AGE OF 65
17.0/ 100
METRIC RATING
202nd/ 347
METRIC RANK
9.8%
SENIORS POVERTY OVER THE AGE OF 65
98.9/ 100
METRIC RATING
61st/ 347
METRIC RANK

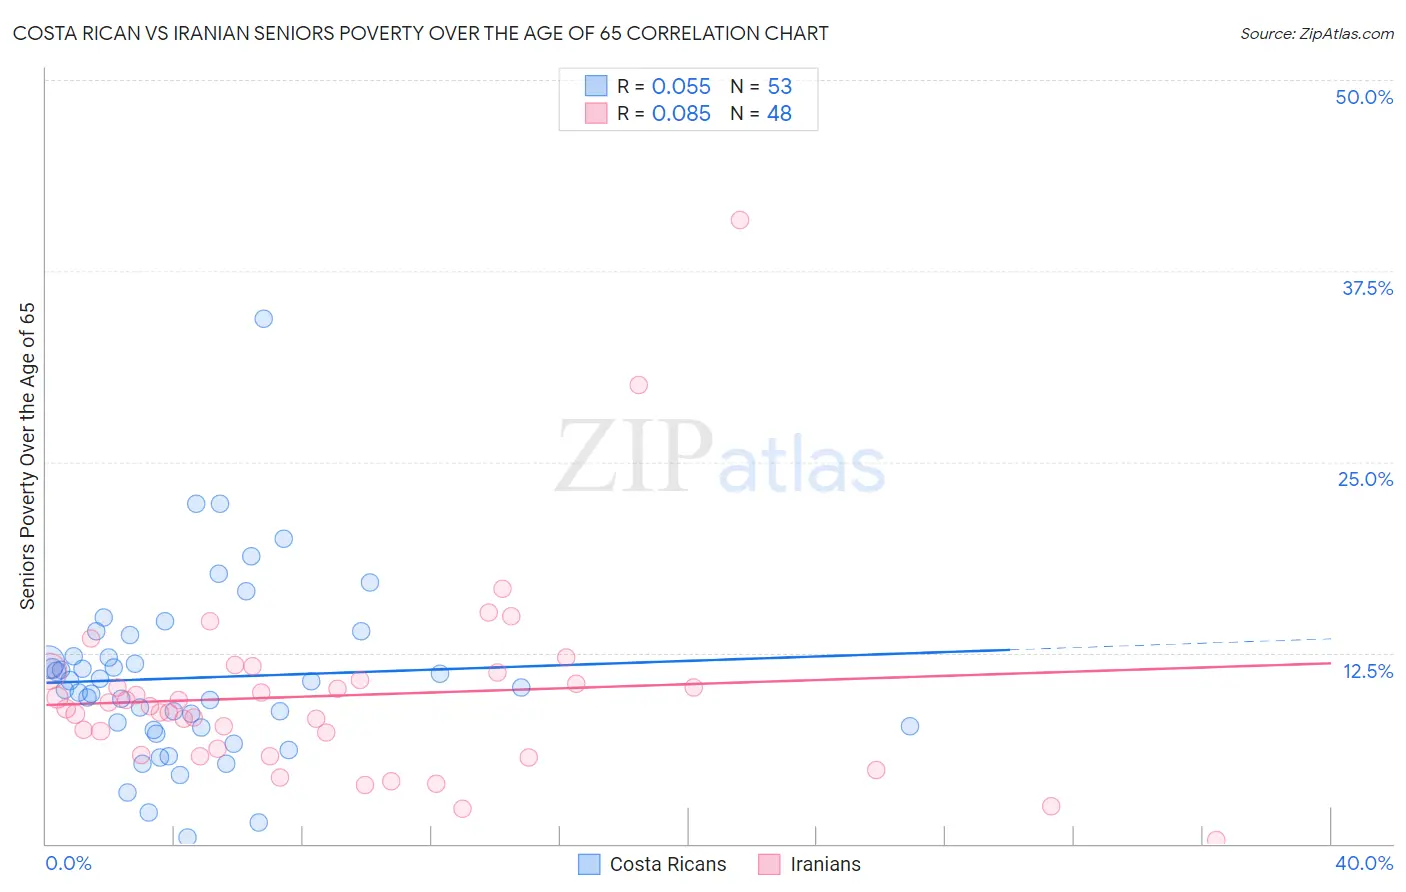
Costa Rican vs Iranian Seniors Poverty Over the Age of 65 Correlation Chart

The statistical analysis conducted on geographies consisting of 253,079,970 people shows a slight positive correlation between the proportion of Costa Ricans and poverty level among seniors over the age of 65 in the United States with a correlation coefficient (R) of 0.055 and weighted average of 11.3%. Similarly, the statistical analysis conducted on geographies consisting of 315,982,705 people shows a slight positive correlation between the proportion of Iranians and poverty level among seniors over the age of 65 in the United States with a correlation coefficient (R) of 0.085 and weighted average of 9.8%, a difference of 15.1%.
Costa Rican vs Iranian Seniors Poverty Over the Age of 65

Seniors Poverty Over the Age of 65 Correlation Summary

MeasurementCosta RicanIranian
Minimum0.37%0.21%
Maximum34.4%40.9%
Range34.0%40.7%
Mean10.9%9.7%
Median10.2%8.9%
Interquartile 25% (IQ1)7.5%6.0%
Interquartile 75% (IQ3)13.0%10.9%
Interquartile Range (IQR)5.5%5.0%
Standard Deviation (Sample)5.8%6.5%
Standard Deviation (Population)5.7%6.5%

Similar Demographics by Seniors Poverty Over the Age of 65

Demographics Similar to Costa Ricans by Seniors Poverty Over the Age of 65

In terms of seniors poverty over the age of 65, the demographic groups most similar to Costa Ricans are Immigrants from Zaire (11.3%, a difference of 0.010%), Israeli (11.3%, a difference of 0.080%), Immigrants from Brazil (11.3%, a difference of 0.12%), Brazilian (11.3%, a difference of 0.25%), and Choctaw (11.4%, a difference of 0.39%).
DemographicsRating | RankSeniors Poverty Over the Age of 65
Immigrants | Vietnam
26.6
/100
|
#195
Fair
11.2%
Bangladeshis
25.2
/100
|
#196
Fair
11.2%
Albanians
24.4
/100
|
#197
Fair
11.2%
Immigrants | Burma/Myanmar
21.3
/100
|
#198
Fair
11.3%
Immigrants | Israel
20.3
/100
|
#199
Fair
11.3%
Alsatians
20.1
/100
|
#200
Fair
11.3%
Immigrants | Brazil
17.8
/100
|
#201
Poor
11.3%
Costa Ricans
17.0
/100
|
#202
Poor
11.3%
Immigrants | Zaire
16.9
/100
|
#203
Poor
11.3%
Israelis
16.5
/100
|
#204
Poor
11.3%
Brazilians
15.4
/100
|
#205
Poor
11.3%
Choctaw
14.5
/100
|
#206
Poor
11.4%
Immigrants | Western Asia
13.6
/100
|
#207
Poor
11.4%
South American Indians
11.7
/100
|
#208
Poor
11.4%
Paraguayans
11.3
/100
|
#209
Poor
11.4%

Demographics Similar to Iranians by Seniors Poverty Over the Age of 65

In terms of seniors poverty over the age of 65, the demographic groups most similar to Iranians are French Canadian (9.8%, a difference of 0.040%), Celtic (9.8%, a difference of 0.080%), Immigrants from Canada (9.8%, a difference of 0.11%), Macedonian (9.9%, a difference of 0.22%), and Serbian (9.8%, a difference of 0.27%).
DemographicsRating | RankSeniors Poverty Over the Age of 65
Immigrants | Northern Europe
99.2
/100
|
#54
Exceptional
9.8%
Afghans
99.2
/100
|
#55
Exceptional
9.8%
Immigrants | England
99.1
/100
|
#56
Exceptional
9.8%
Bolivians
99.1
/100
|
#57
Exceptional
9.8%
Serbians
99.1
/100
|
#58
Exceptional
9.8%
Immigrants | Canada
99.0
/100
|
#59
Exceptional
9.8%
Celtics
99.0
/100
|
#60
Exceptional
9.8%
Iranians
98.9
/100
|
#61
Exceptional
9.8%
French Canadians
98.9
/100
|
#62
Exceptional
9.8%
Macedonians
98.8
/100
|
#63
Exceptional
9.9%
Immigrants | North America
98.8
/100
|
#64
Exceptional
9.9%
Pennsylvania Germans
98.7
/100
|
#65
Exceptional
9.9%
Immigrants | Netherlands
98.7
/100
|
#66
Exceptional
9.9%
Immigrants | Austria
98.6
/100
|
#67
Exceptional
9.9%
Canadians
98.5
/100
|
#68
Exceptional
9.9%