Comanche vs Immigrants from Sierra Leone Female Poverty
COMPARE
Comanche
Immigrants from Sierra Leone
Female Poverty
Female Poverty Comparison
Comanche
Immigrants from Sierra Leone
16.2%
FEMALE POVERTY
0.0/ 100
METRIC RATING
285th/ 347
METRIC RANK
13.5%
FEMALE POVERTY
43.2/ 100
METRIC RATING
184th/ 347
METRIC RANK
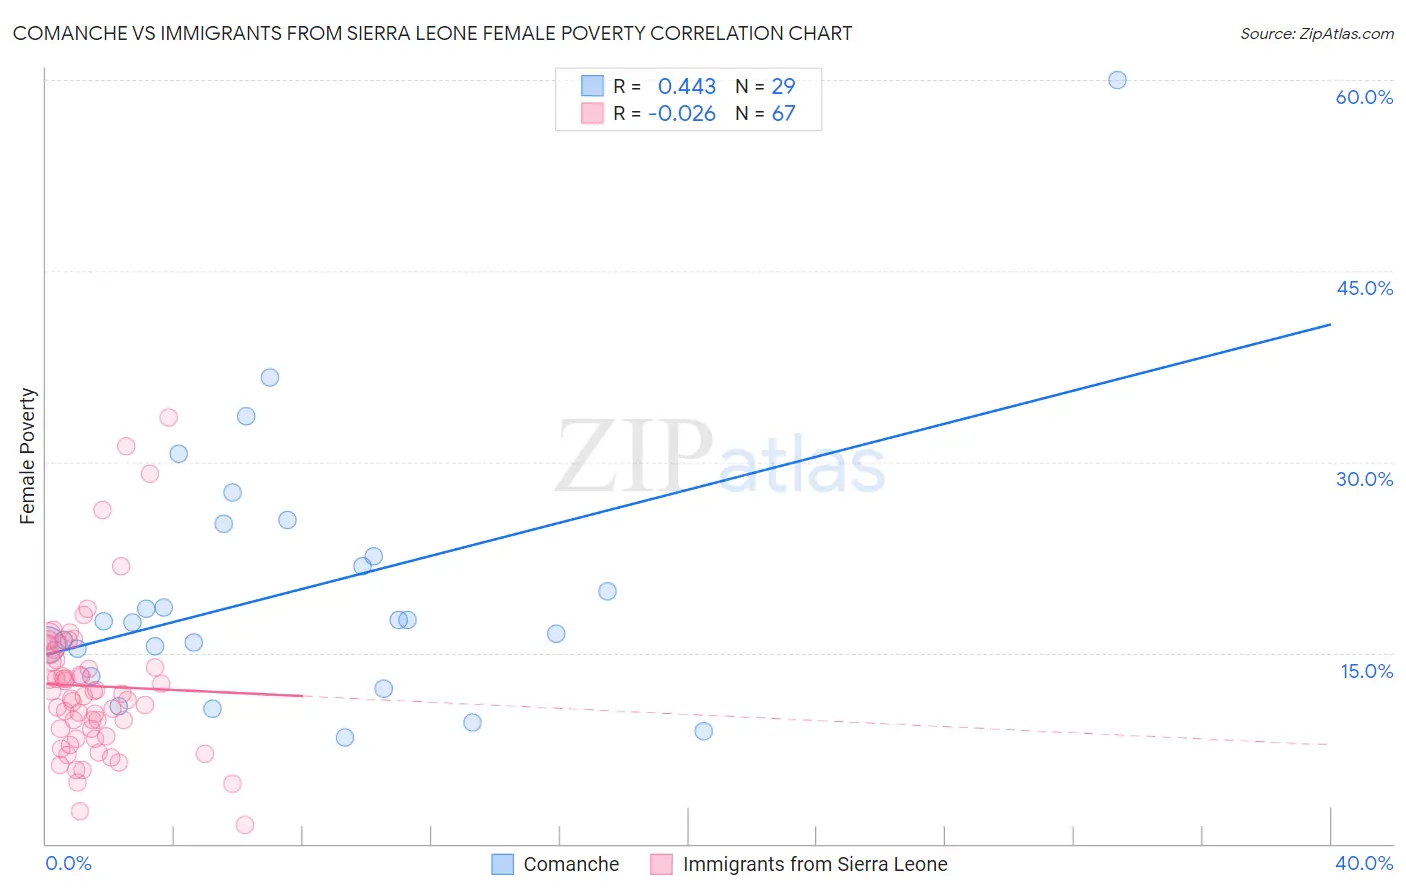
Comanche vs Immigrants from Sierra Leone Female Poverty Correlation Chart
The statistical analysis conducted on geographies consisting of 109,749,855 people shows a moderate positive correlation between the proportion of Comanche and poverty level among females in the United States with a correlation coefficient (R) of 0.443 and weighted average of 16.2%. Similarly, the statistical analysis conducted on geographies consisting of 101,642,339 people shows no correlation between the proportion of Immigrants from Sierra Leone and poverty level among females in the United States with a correlation coefficient (R) of -0.026 and weighted average of 13.5%, a difference of 19.5%.
Female Poverty Correlation Summary
| Measurement | Comanche | Immigrants from Sierra Leone |
| Minimum | 8.4% | 1.5% |
| Maximum | 60.0% | 33.5% |
| Range | 51.6% | 32.0% |
| Mean | 20.0% | 12.4% |
| Median | 17.4% | 11.8% |
| Interquartile 25% (IQ1) | 14.3% | 8.4% |
| Interquartile 75% (IQ3) | 23.9% | 14.9% |
| Interquartile Range (IQR) | 9.6% | 6.4% |
| Standard Deviation (Sample) | 10.5% | 6.0% |
| Standard Deviation (Population) | 10.3% | 5.9% |
Similar Demographics by Female Poverty
Demographics Similar to Comanche by Female Poverty
In terms of female poverty, the demographic groups most similar to Comanche are Spanish American (16.2%, a difference of 0.080%), Immigrants from Cuba (16.1%, a difference of 0.13%), Immigrants from Haiti (16.1%, a difference of 0.21%), West Indian (16.1%, a difference of 0.36%), and Vietnamese (16.1%, a difference of 0.38%).
| Demographics | Rating | Rank | Female Poverty |
| Immigrants | West Indies | 0.0 /100 | #278 | Tragic 16.1% |
| Immigrants | Bahamas | 0.0 /100 | #279 | Tragic 16.1% |
| Vietnamese | 0.0 /100 | #280 | Tragic 16.1% |
| West Indians | 0.0 /100 | #281 | Tragic 16.1% |
| Immigrants | Haiti | 0.0 /100 | #282 | Tragic 16.1% |
| Immigrants | Cuba | 0.0 /100 | #283 | Tragic 16.1% |
| Spanish Americans | 0.0 /100 | #284 | Tragic 16.2% |
| Comanche | 0.0 /100 | #285 | Tragic 16.2% |
| Inupiat | 0.0 /100 | #286 | Tragic 16.2% |
| Immigrants | Belize | 0.0 /100 | #287 | Tragic 16.3% |
| Indonesians | 0.0 /100 | #288 | Tragic 16.4% |
| Blackfeet | 0.0 /100 | #289 | Tragic 16.4% |
| Immigrants | Bangladesh | 0.0 /100 | #290 | Tragic 16.4% |
| Yaqui | 0.0 /100 | #291 | Tragic 16.4% |
| Immigrants | Zaire | 0.0 /100 | #292 | Tragic 16.4% |
Demographics Similar to Immigrants from Sierra Leone by Female Poverty
In terms of female poverty, the demographic groups most similar to Immigrants from Sierra Leone are Kenyan (13.5%, a difference of 0.060%), Immigrants from Cameroon (13.5%, a difference of 0.11%), Venezuelan (13.5%, a difference of 0.13%), Immigrants from Colombia (13.5%, a difference of 0.13%), and South American (13.5%, a difference of 0.16%).
| Demographics | Rating | Rank | Female Poverty |
| Immigrants | Morocco | 49.4 /100 | #177 | Average 13.4% |
| Israelis | 49.1 /100 | #178 | Average 13.5% |
| Immigrants | Syria | 48.8 /100 | #179 | Average 13.5% |
| South Americans | 44.8 /100 | #180 | Average 13.5% |
| Venezuelans | 44.5 /100 | #181 | Average 13.5% |
| Immigrants | Colombia | 44.5 /100 | #182 | Average 13.5% |
| Kenyans | 43.8 /100 | #183 | Average 13.5% |
| Immigrants | Sierra Leone | 43.2 /100 | #184 | Average 13.5% |
| Immigrants | Cameroon | 42.0 /100 | #185 | Average 13.5% |
| Immigrants | Portugal | 41.5 /100 | #186 | Average 13.6% |
| Immigrants | Venezuela | 41.0 /100 | #187 | Average 13.6% |
| Hawaiians | 39.9 /100 | #188 | Fair 13.6% |
| Uruguayans | 39.8 /100 | #189 | Fair 13.6% |
| Sierra Leoneans | 33.1 /100 | #190 | Fair 13.7% |
| Immigrants | Kuwait | 32.7 /100 | #191 | Fair 13.7% |