Comanche vs Guyanese Child Poverty Among Girls Under 16

COMPARE

Comanche
Race
Ancestry
AfghanAfricanAlaska NativeAlaskan AthabascanAlbanianAleutAlsatianAmericanApacheArabArapahoArgentineanArmenianAssyrian/Chaldean/SyriacAustralianAustrianBahamianBangladeshiBarbadianBasqueBelgianBelizeanBermudanBhutaneseBlackfeetBolivianBrazilianBritishBritish West IndianBulgarianBurmeseCajunCambodianCanadianCape VerdeanCarpatho RusynCelticCentral AmericanCentral American IndianCherokeeCheyenneChickasawChileanChineseChippewaChoctawColombianColvilleComancheCosta RicanCreeCreekCroatianCrowCubanCypriotCzechCzechoslovakianDanishDelawareDominicanDutchDutch West IndianEastern EuropeanEcuadorianEgyptianEnglishEstonianEthiopianEuropeanFijianFilipinoFinnishFrenchFrench American IndianFrench CanadianGermanGerman RussianGhanaianGreekGuamanian/ChamorroGuatemalanHaitianHmongHonduranHopiHoumaHungarianIcelanderIndian (Asian)IndonesianInupiatIranianIraqiIrishIroquoisIsraeliItalianJamaicanJapaneseJordanianKenyanKiowaKoreanLaotianLatvianLebaneseLiberianLithuanianLumbeeLuxembourgerMacedonianMalaysianMalteseMarshalleseMenomineeMexicanMexican American IndianMongolianMoroccanNative HawaiianNavajoNepaleseNew ZealanderNicaraguanNigerianNorthern EuropeanNorwegianOkinawanOsageOttawaPaiutePakistaniPalestinianPanamanianParaguayanPennsylvania GermanPeruvianPimaPolishPortuguesePotawatomiPuebloPuerto RicanPuget Sound SalishRomanianRussianSalvadoranSamoanScandinavianScotch-IrishScottishSeminoleSenegaleseSerbianShoshoneSierra LeoneanSiouxSlavicSlovakSloveneSomaliSouth AfricanSouth AmericanSouth American IndianSoviet UnionSpaniardSpanishSpanish AmericanSpanish American IndianSri LankanSubsaharan AfricanSudaneseSwedishSwissSyrianTaiwaneseThaiTlingit-HaidaTohono O'OdhamTonganTrinidadian and TobagonianTsimshianTurkishU.S. Virgin IslanderUgandanUkrainianUruguayanUteVenezuelanVietnameseWelshWest IndianYakamaYaquiYugoslavianYumanYup'ikZimbabwean
Immigration
NonimmigrantsImmigrantsAfghanistanAfricaAlbaniaArgentinaArmeniaAsiaAustraliaAustriaBahamasBangladeshBarbadosBelarusBelgiumBelizeBoliviaBosnia and HerzegovinaBrazilBulgariaBurma/MyanmarCabo VerdeCambodiaCameroonCanadaCaribbeanCentral AmericaChileChinaColombiaCongoCosta RicaCroatiaCubaCzechoslovakiaDenmarkDominicaDominican RepublicEastern AfricaEastern AsiaEastern EuropeEcuadorEgyptEl SalvadorEnglandEritreaEthiopiaEuropeFijiFranceGermanyGhanaGreeceGrenadaGuatemalaGuyanaHaitiHondurasHong KongHungaryIndiaIndonesiaIranIraqIrelandIsraelItalyJamaicaJapanJordanKazakhstanKenyaKoreaKuwaitLaosLatin AmericaLatviaLebanonLiberiaLithuaniaMalaysiaMexicoMicronesiaMiddle AfricaMoldovaMoroccoNepalNetherlandsNicaraguaNigeriaNorth AmericaNorth MacedoniaNorthern AfricaNorthern EuropeNorwayOceaniaPakistanPanamaPeruPhilippinesPolandPortugalRomaniaRussiaSaudi ArabiaScotlandSenegalSerbiaSierra LeoneSingaporeSomaliaSouth AfricaSouth AmericaSouth Central AsiaSouth Eastern AsiaSouthern EuropeSpainSri LankaSt. Vincent and the GrenadinesSudanSwedenSwitzerlandSyriaTaiwanThailandTrinidad and TobagoTurkeyUgandaUkraineUruguayUzbekistanVenezuelaVietnamWest IndiesWestern AfricaWestern AsiaWestern EuropeYemenZaireZimbabweAzores
Guyanese
Race
Ancestry
AfghanAfricanAlaska NativeAlaskan AthabascanAlbanianAleutAlsatianAmericanApacheArabArapahoArgentineanArmenianAssyrian/Chaldean/SyriacAustralianAustrianBahamianBangladeshiBarbadianBasqueBelgianBelizeanBermudanBhutaneseBlackfeetBolivianBrazilianBritishBritish West IndianBulgarianBurmeseCajunCambodianCanadianCape VerdeanCarpatho RusynCelticCentral AmericanCentral American IndianCherokeeCheyenneChickasawChileanChineseChippewaChoctawColombianColvilleCosta RicanCreeCreekCroatianCrowCubanCypriotCzechCzechoslovakianDanishDelawareDominicanDutchDutch West IndianEastern EuropeanEcuadorianEgyptianEnglishEstonianEthiopianEuropeanFijianFilipinoFinnishFrenchFrench American IndianFrench CanadianGermanGerman RussianGhanaianGreekGuamanian/ChamorroGuatemalanGuyaneseHaitianHmongHonduranHopiHoumaHungarianIcelanderIndian (Asian)IndonesianInupiatIranianIraqiIrishIroquoisIsraeliItalianJamaicanJapaneseJordanianKenyanKiowaKoreanLaotianLatvianLebaneseLiberianLithuanianLumbeeLuxembourgerMacedonianMalaysianMalteseMarshalleseMenomineeMexicanMexican American IndianMongolianMoroccanNative HawaiianNavajoNepaleseNew ZealanderNicaraguanNigerianNorthern EuropeanNorwegianOkinawanOsageOttawaPaiutePakistaniPalestinianPanamanianParaguayanPennsylvania GermanPeruvianPimaPolishPortuguesePotawatomiPuebloPuerto RicanPuget Sound SalishRomanianRussianSalvadoranSamoanScandinavianScotch-IrishScottishSeminoleSenegaleseSerbianShoshoneSierra LeoneanSiouxSlavicSlovakSloveneSomaliSouth AfricanSouth AmericanSouth American IndianSoviet UnionSpaniardSpanishSpanish AmericanSpanish American IndianSri LankanSubsaharan AfricanSudaneseSwedishSwissSyrianTaiwaneseThaiTlingit-HaidaTohono O'OdhamTonganTrinidadian and TobagonianTsimshianTurkishU.S. Virgin IslanderUgandanUkrainianUruguayanUteVenezuelanVietnameseWelshWest IndianYakamaYaquiYugoslavianYumanYup'ikZimbabwean
Immigration
NonimmigrantsImmigrantsAfghanistanAfricaAlbaniaArgentinaArmeniaAsiaAustraliaAustriaBahamasBangladeshBarbadosBelarusBelgiumBelizeBoliviaBosnia and HerzegovinaBrazilBulgariaBurma/MyanmarCabo VerdeCambodiaCameroonCanadaCaribbeanCentral AmericaChileChinaColombiaCongoCosta RicaCroatiaCubaCzechoslovakiaDenmarkDominicaDominican RepublicEastern AfricaEastern AsiaEastern EuropeEcuadorEgyptEl SalvadorEnglandEritreaEthiopiaEuropeFijiFranceGermanyGhanaGreeceGrenadaGuatemalaGuyanaHaitiHondurasHong KongHungaryIndiaIndonesiaIranIraqIrelandIsraelItalyJamaicaJapanJordanKazakhstanKenyaKoreaKuwaitLaosLatin AmericaLatviaLebanonLiberiaLithuaniaMalaysiaMexicoMicronesiaMiddle AfricaMoldovaMoroccoNepalNetherlandsNicaraguaNigeriaNorth AmericaNorth MacedoniaNorthern AfricaNorthern EuropeNorwayOceaniaPakistanPanamaPeruPhilippinesPolandPortugalRomaniaRussiaSaudi ArabiaScotlandSenegalSerbiaSierra LeoneSingaporeSomaliaSouth AfricaSouth AmericaSouth Central AsiaSouth Eastern AsiaSouthern EuropeSpainSri LankaSt. Vincent and the GrenadinesSudanSwedenSwitzerlandSyriaTaiwanThailandTrinidad and TobagoTurkeyUgandaUkraineUruguayUzbekistanVenezuelaVietnamWest IndiesWestern AfricaWestern AsiaWestern EuropeYemenZaireZimbabweAzores
Child Poverty Among Girls Under 16
Income
Poverty
Unemployment
Labor Participation
Family Structure
Vehicle Availability
Education Level
Disability

Child Poverty Among Girls Under 16 Comparison

Comanche

Guyanese

Tragic
Tragic
20.2%
CHILD POVERTY AMONG GIRLS UNDER 16
0.0/ 100
METRIC RATING
276th/ 347
METRIC RANK
19.4%
CHILD POVERTY AMONG GIRLS UNDER 16
0.2/ 100
METRIC RATING
257th/ 347
METRIC RANK

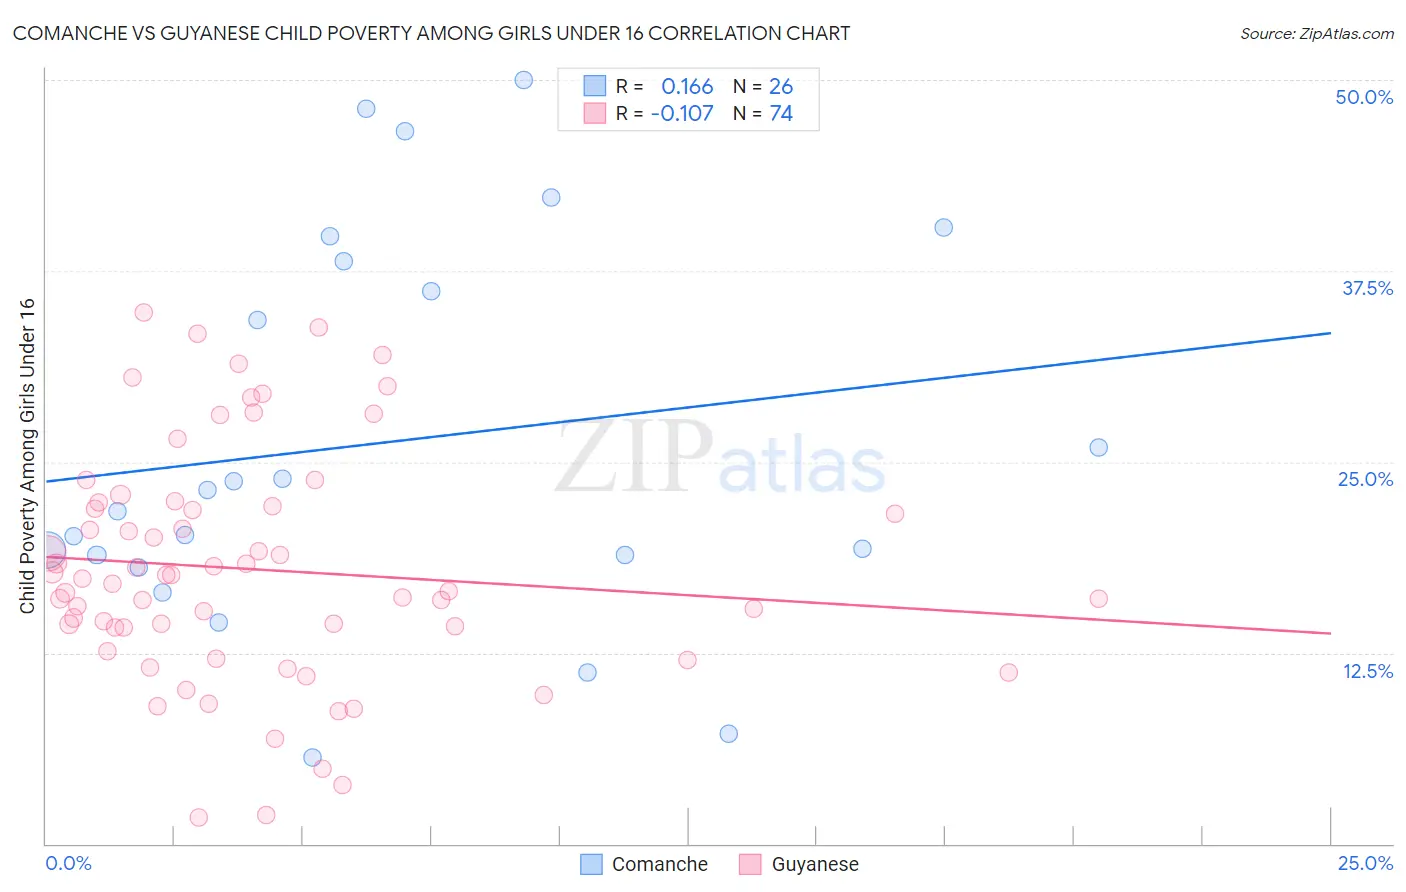
Comanche vs Guyanese Child Poverty Among Girls Under 16 Correlation Chart

The statistical analysis conducted on geographies consisting of 109,392,517 people shows a poor positive correlation between the proportion of Comanche and poverty level among girls under the age of 16 in the United States with a correlation coefficient (R) of 0.166 and weighted average of 20.2%. Similarly, the statistical analysis conducted on geographies consisting of 175,189,173 people shows a poor negative correlation between the proportion of Guyanese and poverty level among girls under the age of 16 in the United States with a correlation coefficient (R) of -0.107 and weighted average of 19.4%, a difference of 4.2%.
Comanche vs Guyanese Child Poverty Among Girls Under 16

Child Poverty Among Girls Under 16 Correlation Summary

MeasurementComancheGuyanese
Minimum5.6%1.7%
Maximum50.0%34.8%
Range44.4%33.1%
Mean26.3%18.0%
Median22.5%17.2%
Interquartile 25% (IQ1)18.9%14.1%
Interquartile 75% (IQ3)38.2%22.1%
Interquartile Range (IQR)19.3%8.0%
Standard Deviation (Sample)12.7%7.6%
Standard Deviation (Population)12.5%7.5%

Demographics Similar to Comanche and Guyanese by Child Poverty Among Girls Under 16

In terms of child poverty among girls under 16, the demographic groups most similar to Comanche are Subsaharan African (20.1%, a difference of 0.32%), Immigrants from St. Vincent and the Grenadines (20.1%, a difference of 0.46%), Bangladeshi (20.0%, a difference of 0.89%), Immigrants from El Salvador (20.0%, a difference of 1.1%), and Immigrants from Barbados (19.9%, a difference of 1.2%). Similarly, the demographic groups most similar to Guyanese are Salvadoran (19.4%, a difference of 0.13%), Ottawa (19.4%, a difference of 0.23%), Trinidadian and Tobagonian (19.3%, a difference of 0.25%), Mexican American Indian (19.5%, a difference of 0.80%), and Vietnamese (19.5%, a difference of 0.89%).
DemographicsRating | RankChild Poverty Among Girls Under 16
Trinidadians and Tobagonians
0.2
/100
|
#256
Tragic
19.3%
Guyanese
0.2
/100
|
#257
Tragic
19.4%
Salvadorans
0.2
/100
|
#258
Tragic
19.4%
Ottawa
0.2
/100
|
#259
Tragic
19.4%
Mexican American Indians
0.2
/100
|
#260
Tragic
19.5%
Vietnamese
0.2
/100
|
#261
Tragic
19.5%
Chickasaw
0.1
/100
|
#262
Tragic
19.6%
Immigrants | Burma/Myanmar
0.1
/100
|
#263
Tragic
19.7%
Jamaicans
0.1
/100
|
#264
Tragic
19.7%
Immigrants | Jamaica
0.1
/100
|
#265
Tragic
19.8%
Spanish Americans
0.1
/100
|
#266
Tragic
19.8%
Immigrants | Bangladesh
0.1
/100
|
#267
Tragic
19.9%
Spanish American Indians
0.1
/100
|
#268
Tragic
19.9%
Liberians
0.1
/100
|
#269
Tragic
19.9%
Cherokee
0.1
/100
|
#270
Tragic
19.9%
Immigrants | Barbados
0.1
/100
|
#271
Tragic
19.9%
Immigrants | El Salvador
0.1
/100
|
#272
Tragic
20.0%
Bangladeshis
0.1
/100
|
#273
Tragic
20.0%
Immigrants | St. Vincent and the Grenadines
0.0
/100
|
#274
Tragic
20.1%
Sub-Saharan Africans
0.0
/100
|
#275
Tragic
20.1%
Comanche
0.0
/100
|
#276
Tragic
20.2%