Colville vs Scandinavian Single Father Poverty
COMPARE
Colville
Scandinavian
Single Father Poverty
Single Father Poverty Comparison
Colville
Scandinavians
21.4%
SINGLE FATHER POVERTY
0.0/ 100
METRIC RATING
329th/ 347
METRIC RANK
16.3%
SINGLE FATHER POVERTY
52.3/ 100
METRIC RATING
170th/ 347
METRIC RANK
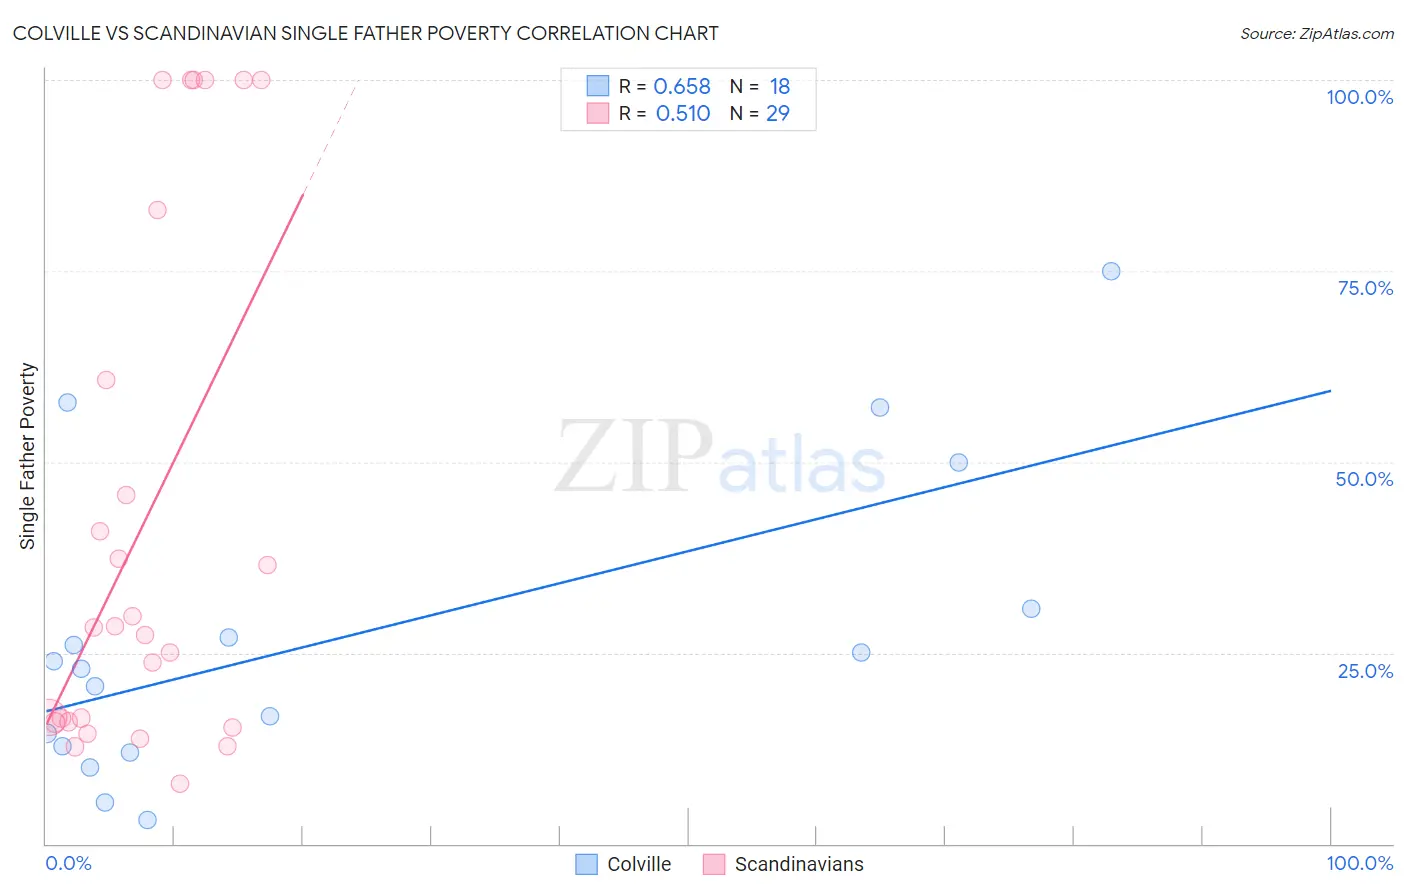
Colville vs Scandinavian Single Father Poverty Correlation Chart
The statistical analysis conducted on geographies consisting of 32,657,120 people shows a significant positive correlation between the proportion of Colville and poverty level among single fathers in the United States with a correlation coefficient (R) of 0.658 and weighted average of 21.4%. Similarly, the statistical analysis conducted on geographies consisting of 353,551,665 people shows a substantial positive correlation between the proportion of Scandinavians and poverty level among single fathers in the United States with a correlation coefficient (R) of 0.510 and weighted average of 16.3%, a difference of 31.2%.
Single Father Poverty Correlation Summary
| Measurement | Colville | Scandinavian |
| Minimum | 3.1% | 7.8% |
| Maximum | 75.0% | 100.0% |
| Range | 71.9% | 92.2% |
| Mean | 27.3% | 42.2% |
| Median | 23.4% | 28.3% |
| Interquartile 25% (IQ1) | 12.8% | 15.9% |
| Interquartile 75% (IQ3) | 30.8% | 71.8% |
| Interquartile Range (IQR) | 18.0% | 55.9% |
| Standard Deviation (Sample) | 20.0% | 33.9% |
| Standard Deviation (Population) | 19.4% | 33.3% |
Similar Demographics by Single Father Poverty
Demographics Similar to Colville by Single Father Poverty
In terms of single father poverty, the demographic groups most similar to Colville are Pueblo (21.1%, a difference of 1.1%), Paiute (21.6%, a difference of 1.3%), Central American Indian (21.7%, a difference of 1.5%), Choctaw (20.7%, a difference of 3.0%), and Tohono O'odham (22.0%, a difference of 3.1%).
| Demographics | Rating | Rank | Single Father Poverty |
| Creek | 0.0 /100 | #322 | Tragic 19.8% |
| Pennsylvania Germans | 0.0 /100 | #323 | Tragic 20.0% |
| Americans | 0.0 /100 | #324 | Tragic 20.1% |
| Blacks/African Americans | 0.0 /100 | #325 | Tragic 20.4% |
| Immigrants | Yemen | 0.0 /100 | #326 | Tragic 20.6% |
| Choctaw | 0.0 /100 | #327 | Tragic 20.7% |
| Pueblo | 0.0 /100 | #328 | Tragic 21.1% |
| Colville | 0.0 /100 | #329 | Tragic 21.4% |
| Paiute | 0.0 /100 | #330 | Tragic 21.6% |
| Central American Indians | 0.0 /100 | #331 | Tragic 21.7% |
| Tohono O'odham | 0.0 /100 | #332 | Tragic 22.0% |
| Natives/Alaskans | 0.0 /100 | #333 | Tragic 22.4% |
| Kiowa | 0.0 /100 | #334 | Tragic 22.5% |
| Shoshone | 0.0 /100 | #335 | Tragic 22.9% |
| Cajuns | 0.0 /100 | #336 | Tragic 23.1% |
Demographics Similar to Scandinavians by Single Father Poverty
In terms of single father poverty, the demographic groups most similar to Scandinavians are Northern European (16.3%, a difference of 0.020%), Costa Rican (16.3%, a difference of 0.060%), Yugoslavian (16.3%, a difference of 0.070%), Immigrants from Morocco (16.3%, a difference of 0.070%), and Immigrants from Sierra Leone (16.3%, a difference of 0.10%).
| Demographics | Rating | Rank | Single Father Poverty |
| Immigrants | Costa Rica | 55.7 /100 | #163 | Average 16.3% |
| Guyanese | 55.2 /100 | #164 | Average 16.3% |
| Immigrants | Bangladesh | 55.1 /100 | #165 | Average 16.3% |
| Immigrants | Europe | 54.8 /100 | #166 | Average 16.3% |
| Yugoslavians | 53.9 /100 | #167 | Average 16.3% |
| Costa Ricans | 53.6 /100 | #168 | Average 16.3% |
| Northern Europeans | 52.8 /100 | #169 | Average 16.3% |
| Scandinavians | 52.3 /100 | #170 | Average 16.3% |
| Immigrants | Morocco | 50.7 /100 | #171 | Average 16.3% |
| Immigrants | Sierra Leone | 50.1 /100 | #172 | Average 16.3% |
| Immigrants | St. Vincent and the Grenadines | 50.0 /100 | #173 | Average 16.3% |
| Swedes | 50.0 /100 | #174 | Average 16.3% |
| Immigrants | Ecuador | 49.7 /100 | #175 | Average 16.3% |
| Vietnamese | 48.0 /100 | #176 | Average 16.3% |
| Immigrants | South Africa | 44.2 /100 | #177 | Average 16.3% |