Choctaw vs Yuman Child Poverty Under the Age of 16

COMPARE

Choctaw
Race
Ancestry
AfghanAfricanAlaska NativeAlaskan AthabascanAlbanianAleutAlsatianAmericanApacheArabArapahoArgentineanArmenianAssyrian/Chaldean/SyriacAustralianAustrianBahamianBangladeshiBarbadianBasqueBelgianBelizeanBermudanBhutaneseBlackfeetBolivianBrazilianBritishBritish West IndianBulgarianBurmeseCajunCambodianCanadianCape VerdeanCarpatho RusynCelticCentral AmericanCentral American IndianCherokeeCheyenneChickasawChileanChineseChippewaChoctawColombianColvilleComancheCosta RicanCreeCreekCroatianCrowCubanCypriotCzechCzechoslovakianDanishDelawareDominicanDutchDutch West IndianEastern EuropeanEcuadorianEgyptianEnglishEstonianEthiopianEuropeanFijianFilipinoFinnishFrenchFrench American IndianFrench CanadianGermanGerman RussianGhanaianGreekGuamanian/ChamorroGuatemalanGuyaneseHaitianHmongHonduranHopiHoumaHungarianIcelanderIndian (Asian)IndonesianInupiatIranianIraqiIrishIroquoisIsraeliItalianJamaicanJapaneseJordanianKenyanKiowaKoreanLaotianLatvianLebaneseLiberianLithuanianLumbeeLuxembourgerMacedonianMalaysianMalteseMarshalleseMenomineeMexicanMexican American IndianMongolianMoroccanNative HawaiianNavajoNepaleseNew ZealanderNicaraguanNigerianNorthern EuropeanNorwegianOkinawanOsageOttawaPaiutePakistaniPalestinianPanamanianParaguayanPennsylvania GermanPeruvianPimaPolishPortuguesePotawatomiPuebloPuerto RicanPuget Sound SalishRomanianRussianSalvadoranSamoanScandinavianScotch-IrishScottishSeminoleSenegaleseSerbianShoshoneSierra LeoneanSiouxSlavicSlovakSloveneSomaliSouth AfricanSouth AmericanSouth American IndianSoviet UnionSpaniardSpanishSpanish AmericanSpanish American IndianSri LankanSubsaharan AfricanSudaneseSwedishSwissSyrianTaiwaneseThaiTlingit-HaidaTohono O'OdhamTonganTrinidadian and TobagonianTsimshianTurkishU.S. Virgin IslanderUgandanUkrainianUruguayanUteVenezuelanVietnameseWelshWest IndianYakamaYaquiYugoslavianYup'ikZimbabwean
Immigration
NonimmigrantsImmigrantsAfghanistanAfricaAlbaniaArgentinaArmeniaAsiaAustraliaAustriaBahamasBangladeshBarbadosBelarusBelgiumBelizeBoliviaBosnia and HerzegovinaBrazilBulgariaBurma/MyanmarCabo VerdeCambodiaCameroonCanadaCaribbeanCentral AmericaChileChinaColombiaCongoCosta RicaCroatiaCubaCzechoslovakiaDenmarkDominicaDominican RepublicEastern AfricaEastern AsiaEastern EuropeEcuadorEgyptEl SalvadorEnglandEritreaEthiopiaEuropeFijiFranceGermanyGhanaGreeceGrenadaGuatemalaGuyanaHaitiHondurasHong KongHungaryIndiaIndonesiaIranIraqIrelandIsraelItalyJamaicaJapanJordanKazakhstanKenyaKoreaKuwaitLaosLatin AmericaLatviaLebanonLiberiaLithuaniaMalaysiaMexicoMicronesiaMiddle AfricaMoldovaMoroccoNepalNetherlandsNicaraguaNigeriaNorth AmericaNorth MacedoniaNorthern AfricaNorthern EuropeNorwayOceaniaPakistanPanamaPeruPhilippinesPolandPortugalRomaniaRussiaSaudi ArabiaScotlandSenegalSerbiaSierra LeoneSingaporeSomaliaSouth AfricaSouth AmericaSouth Central AsiaSouth Eastern AsiaSouthern EuropeSpainSri LankaSt. Vincent and the GrenadinesSudanSwedenSwitzerlandSyriaTaiwanThailandTrinidad and TobagoTurkeyUgandaUkraineUruguayUzbekistanVenezuelaVietnamWest IndiesWestern AfricaWestern AsiaWestern EuropeYemenZaireZimbabweAzores
Yuman
Race
Ancestry
AfghanAfricanAlaska NativeAlaskan AthabascanAlbanianAleutAlsatianAmericanApacheArabArapahoArgentineanArmenianAssyrian/Chaldean/SyriacAustralianAustrianBahamianBangladeshiBarbadianBasqueBelgianBelizeanBermudanBhutaneseBlackfeetBolivianBrazilianBritishBritish West IndianBulgarianBurmeseCajunCambodianCanadianCape VerdeanCarpatho RusynCelticCentral AmericanCentral American IndianCherokeeCheyenneChickasawChileanChineseChippewaColombianColvilleComancheCosta RicanCreeCreekCroatianCrowCubanCypriotCzechCzechoslovakianDanishDelawareDominicanDutchDutch West IndianEastern EuropeanEcuadorianEgyptianEnglishEstonianEthiopianEuropeanFijianFilipinoFinnishFrenchFrench American IndianFrench CanadianGermanGerman RussianGhanaianGreekGuamanian/ChamorroGuatemalanGuyaneseHaitianHmongHonduranHopiHoumaHungarianIcelanderIndian (Asian)IndonesianInupiatIranianIraqiIrishIroquoisIsraeliItalianJamaicanJapaneseJordanianKenyanKiowaKoreanLaotianLatvianLebaneseLiberianLithuanianLumbeeLuxembourgerMacedonianMalaysianMalteseMarshalleseMenomineeMexicanMexican American IndianMongolianMoroccanNative HawaiianNavajoNepaleseNew ZealanderNicaraguanNigerianNorthern EuropeanNorwegianOkinawanOsageOttawaPaiutePakistaniPalestinianPanamanianParaguayanPennsylvania GermanPeruvianPimaPolishPortuguesePotawatomiPuebloPuerto RicanPuget Sound SalishRomanianRussianSalvadoranSamoanScandinavianScotch-IrishScottishSeminoleSenegaleseSerbianShoshoneSierra LeoneanSiouxSlavicSlovakSloveneSomaliSouth AfricanSouth AmericanSouth American IndianSoviet UnionSpaniardSpanishSpanish AmericanSpanish American IndianSri LankanSubsaharan AfricanSudaneseSwedishSwissSyrianTaiwaneseThaiTlingit-HaidaTohono O'OdhamTonganTrinidadian and TobagonianTsimshianTurkishU.S. Virgin IslanderUgandanUkrainianUruguayanUteVenezuelanVietnameseWelshWest IndianYakamaYaquiYugoslavianYumanYup'ikZimbabwean
Immigration
NonimmigrantsImmigrantsAfghanistanAfricaAlbaniaArgentinaArmeniaAsiaAustraliaAustriaBahamasBangladeshBarbadosBelarusBelgiumBelizeBoliviaBosnia and HerzegovinaBrazilBulgariaBurma/MyanmarCabo VerdeCambodiaCameroonCanadaCaribbeanCentral AmericaChileChinaColombiaCongoCosta RicaCroatiaCubaCzechoslovakiaDenmarkDominicaDominican RepublicEastern AfricaEastern AsiaEastern EuropeEcuadorEgyptEl SalvadorEnglandEritreaEthiopiaEuropeFijiFranceGermanyGhanaGreeceGrenadaGuatemalaGuyanaHaitiHondurasHong KongHungaryIndiaIndonesiaIranIraqIrelandIsraelItalyJamaicaJapanJordanKazakhstanKenyaKoreaKuwaitLaosLatin AmericaLatviaLebanonLiberiaLithuaniaMalaysiaMexicoMicronesiaMiddle AfricaMoldovaMoroccoNepalNetherlandsNicaraguaNigeriaNorth AmericaNorth MacedoniaNorthern AfricaNorthern EuropeNorwayOceaniaPakistanPanamaPeruPhilippinesPolandPortugalRomaniaRussiaSaudi ArabiaScotlandSenegalSerbiaSierra LeoneSingaporeSomaliaSouth AfricaSouth AmericaSouth Central AsiaSouth Eastern AsiaSouthern EuropeSpainSri LankaSt. Vincent and the GrenadinesSudanSwedenSwitzerlandSyriaTaiwanThailandTrinidad and TobagoTurkeyUgandaUkraineUruguayUzbekistanVenezuelaVietnamWest IndiesWestern AfricaWestern AsiaWestern EuropeYemenZaireZimbabweAzores
Child Poverty Under the Age of 16
Income
Poverty
Unemployment
Labor Participation
Family Structure
Vehicle Availability
Education Level
Disability

Child Poverty Under the Age of 16 Comparison

Choctaw

Yuman

Tragic
Tragic
21.0%
CHILD POVERTY UNDER THE AGE OF 16
0.0/ 100
METRIC RATING
303rd/ 347
METRIC RANK
28.9%
CHILD POVERTY UNDER THE AGE OF 16
0.0/ 100
METRIC RATING
341st/ 347
METRIC RANK

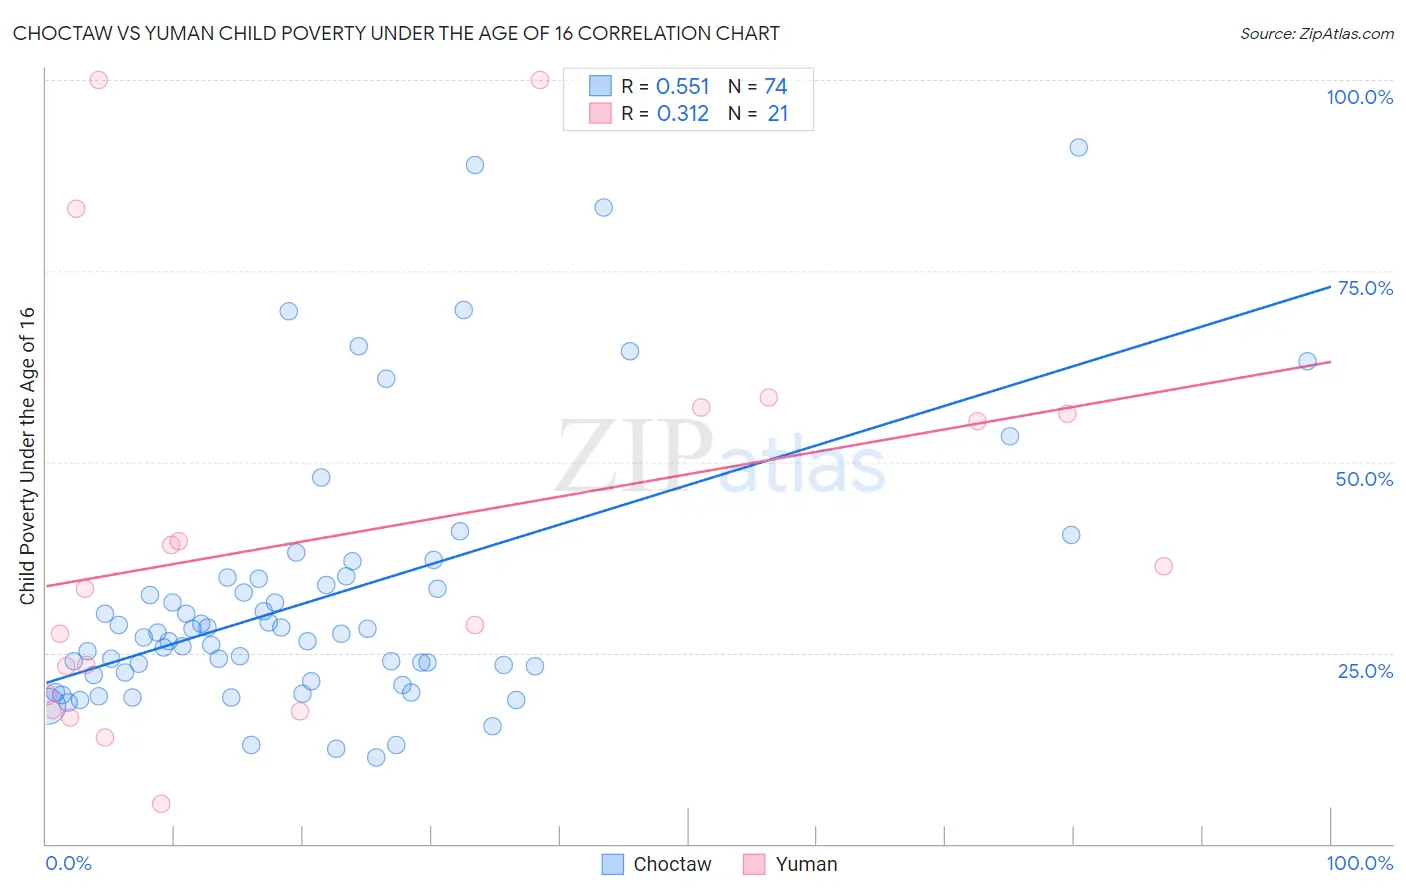
Choctaw vs Yuman Child Poverty Under the Age of 16 Correlation Chart

The statistical analysis conducted on geographies consisting of 268,590,818 people shows a substantial positive correlation between the proportion of Choctaw and poverty level among children under the age of 16 in the United States with a correlation coefficient (R) of 0.551 and weighted average of 21.0%. Similarly, the statistical analysis conducted on geographies consisting of 40,623,362 people shows a mild positive correlation between the proportion of Yuman and poverty level among children under the age of 16 in the United States with a correlation coefficient (R) of 0.312 and weighted average of 28.9%, a difference of 37.7%.
Choctaw vs Yuman Child Poverty Under the Age of 16

Child Poverty Under the Age of 16 Correlation Summary

MeasurementChoctawYuman
Minimum11.4%5.3%
Maximum91.2%100.0%
Range79.9%94.7%
Mean32.2%40.6%
Median27.2%33.4%
Interquartile 25% (IQ1)22.1%18.5%
Interquartile 75% (IQ3)34.7%56.7%
Interquartile Range (IQR)12.6%38.2%
Standard Deviation (Sample)17.5%27.4%
Standard Deviation (Population)17.4%26.7%

Similar Demographics by Child Poverty Under the Age of 16

Demographics Similar to Choctaw by Child Poverty Under the Age of 16

In terms of child poverty under the age of 16, the demographic groups most similar to Choctaw are Immigrants from Bahamas (21.0%, a difference of 0.040%), Somali (21.0%, a difference of 0.050%), Immigrants from Grenada (21.0%, a difference of 0.28%), Indonesian (21.0%, a difference of 0.32%), and Seminole (21.1%, a difference of 0.52%).
DemographicsRating | RankChild Poverty Under the Age of 16
Immigrants | Caribbean
0.0
/100
|
#296
Tragic
20.8%
Hispanics or Latinos
0.0
/100
|
#297
Tragic
20.8%
Arapaho
0.0
/100
|
#298
Tragic
20.8%
Immigrants | Haiti
0.0
/100
|
#299
Tragic
20.9%
Indonesians
0.0
/100
|
#300
Tragic
21.0%
Immigrants | Grenada
0.0
/100
|
#301
Tragic
21.0%
Immigrants | Bahamas
0.0
/100
|
#302
Tragic
21.0%
Choctaw
0.0
/100
|
#303
Tragic
21.0%
Somalis
0.0
/100
|
#304
Tragic
21.0%
Seminole
0.0
/100
|
#305
Tragic
21.1%
Guatemalans
0.0
/100
|
#306
Tragic
21.2%
Immigrants | Central America
0.0
/100
|
#307
Tragic
21.3%
British West Indians
0.0
/100
|
#308
Tragic
21.3%
Immigrants | Mexico
0.0
/100
|
#309
Tragic
21.5%
Bahamians
0.0
/100
|
#310
Tragic
21.5%

Demographics Similar to Yuman by Child Poverty Under the Age of 16

In terms of child poverty under the age of 16, the demographic groups most similar to Yuman are Pima (29.0%, a difference of 0.26%), Immigrants from Yemen (29.1%, a difference of 0.46%), Navajo (30.2%, a difference of 4.4%), Hopi (27.1%, a difference of 6.8%), and Lumbee (31.0%, a difference of 7.0%).
DemographicsRating | RankChild Poverty Under the Age of 16
Immigrants | Dominican Republic
0.0
/100
|
#333
Tragic
24.0%
Blacks/African Americans
0.0
/100
|
#334
Tragic
24.4%
Houma
0.0
/100
|
#335
Tragic
24.9%
Yup'ik
0.0
/100
|
#336
Tragic
25.1%
Sioux
0.0
/100
|
#337
Tragic
25.2%
Cheyenne
0.0
/100
|
#338
Tragic
25.4%
Crow
0.0
/100
|
#339
Tragic
26.0%
Hopi
0.0
/100
|
#340
Tragic
27.1%
Yuman
0.0
/100
|
#341
Tragic
28.9%
Pima
0.0
/100
|
#342
Tragic
29.0%
Immigrants | Yemen
0.0
/100
|
#343
Tragic
29.1%
Navajo
0.0
/100
|
#344
Tragic
30.2%
Lumbee
0.0
/100
|
#345
Tragic
31.0%
Tohono O'odham
0.0
/100
|
#346
Tragic
31.7%
Puerto Ricans
0.0
/100
|
#347
Tragic
32.5%